
Figure 3.
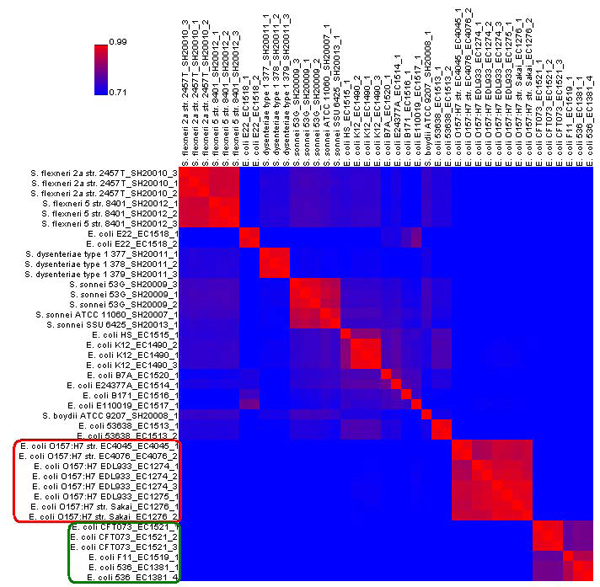
Flag concordance heat map of all 41 E. coli and Shigella samples in the FDA-ECSG validation dataset Heat map created using ArrayTrackTM’s default settings. The samples are reorganized using a clustering algorithm that places similar samples together. The areas in red within the heat map indicate high similarity. The E. coli O157:H7 samples are circled in red, while the E. coli 536_EC1381, E. coli F11_EC1519, and E. coli CFT073_EC1521 samples are circled in green. Both of these two groups are noted for their high within-group similarity values.