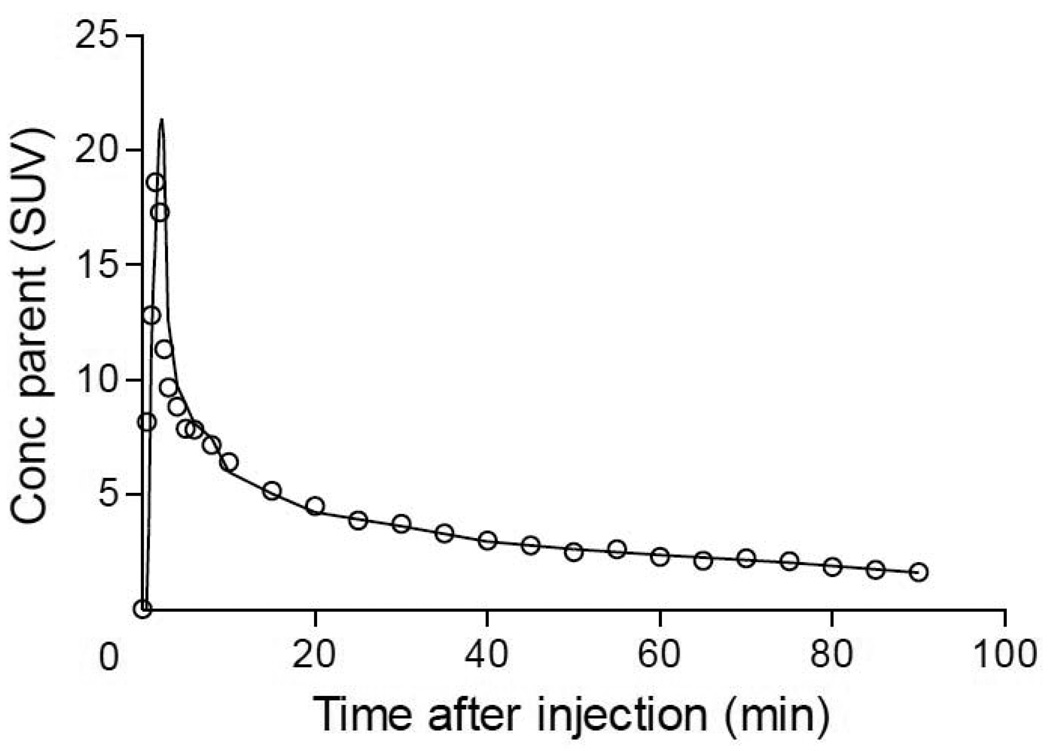
Figure 5.
[11C](R)-rolipram parent concentration over time obtained from the image input function ( ) and from the arterial input function (○) of a representative healthy subject. The parent fraction has been estimated by fitting a monoexponential function through the parent/whole blood ratio measured in the four blood samples used to calculate the image-derived input function.

