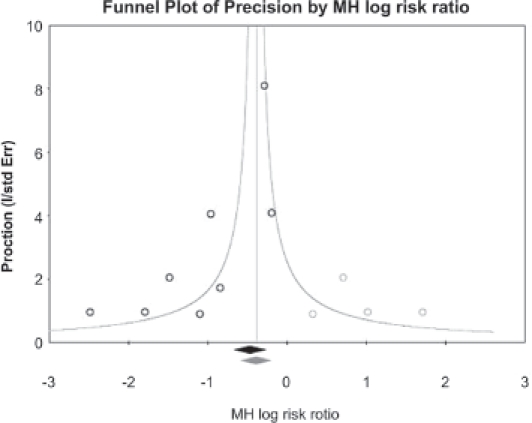
Figure 1.

Publication bias assessment and robustness testing: funnel plot with a Duval and Tweedie Trim and Fill sensitivity analysis. This graph plots the log RR against the studies precision (open circles), as well as the log global estimate (black lozenge). The assumption of no publication bias is linked to a symmetrical distribution of the studies on the left and right sides of the global estimate (which shows an inverted funnel). In case of asymmetry, Duval and Tweedie set up a method that allows for simulating the “missing” studies (open grey circles) that make the graph symmetrical. When including these dummy studies, a new global estimate can be recomputed (grey lozenge) for comparison with the actual global estimate. Table V provides the global estimates with and without correction. What can be seen is that whatever the correction applied (as a sensitivity analysis), the estimates remain significant, showing that no significant publication bias affects the dataset.
