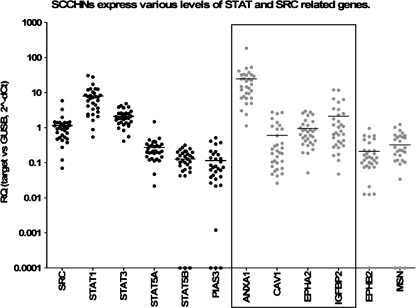
Figure 1.
Relative expression of STAT and SRC-related genes in LA-SCCHN. The distribution of RQ values reflecting the presence of gene transcripts in comparison to those of GUSB (housekeeping gene) is presented in a logarithmic scale. Horizontal lines correspond to mean values per category; black dots, SRC/STAT genes; gray dots, genes producing SRC target proteins, some of which (box) are included in the proposed gene signature predicting for response to dasatinib.

