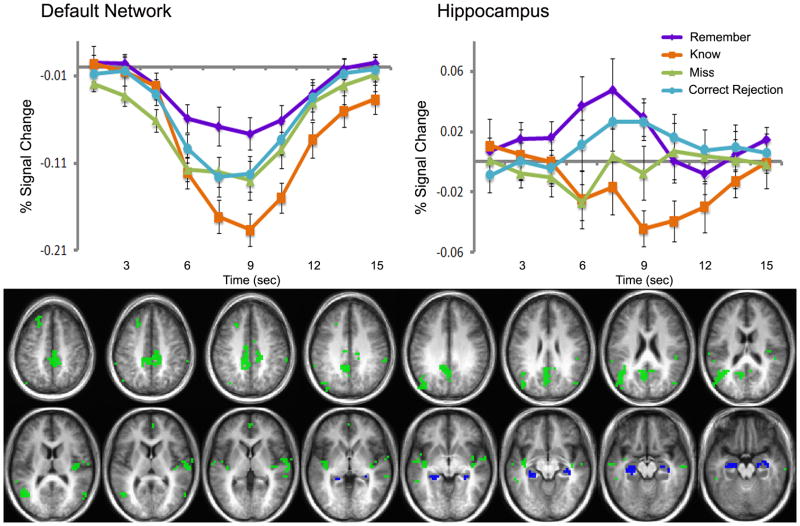
Figure 2.
Default network and hippocampus activity in the ‘remember minus know’ contrast (p<.01). Cluster map (below) shows regions of overlap between the default network (defined as regions of deactivation in task minus no task contrast, green) and hippocampus (defined anatomically, blue) and the ‘remember minus know’ contrast (p<.01). Clusters overlaid on an average anatomical brain of all 12 study participants. Impulse response curves in the default network (top left) and hippocampus (top right) for ‘remember’ (purple), ‘know’ (orange), ‘misses’ (green), and ‘correct rejection’ (light blue) judgment trials. Y-axis is percent signal change; X-axis is time (seconds) after the onset of the stimulus.

