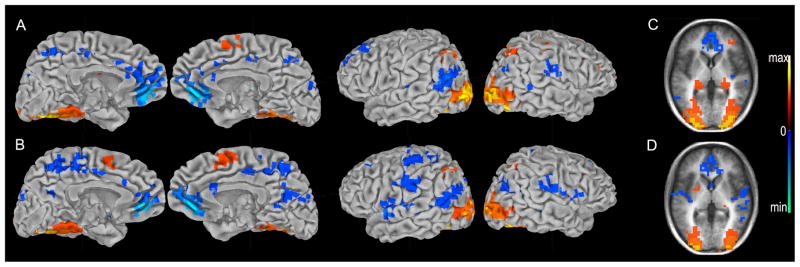
Figure 4.
Regions correlated with reaction time. Map of regions positively and negatively correlated with reaction time for ‘remember’ trials (A, C) and ‘know’ trials (B, D). Cluster maps for correct ‘remember’ and ‘know’ trials are presented on the pial surface of the Talaraich and Tournoux N27 average brain (A, B), and on an average anatomical brain of the 12 study participants (C, D). (p<.01, warm colors = positive correlation, cool colors = negative correlation)

