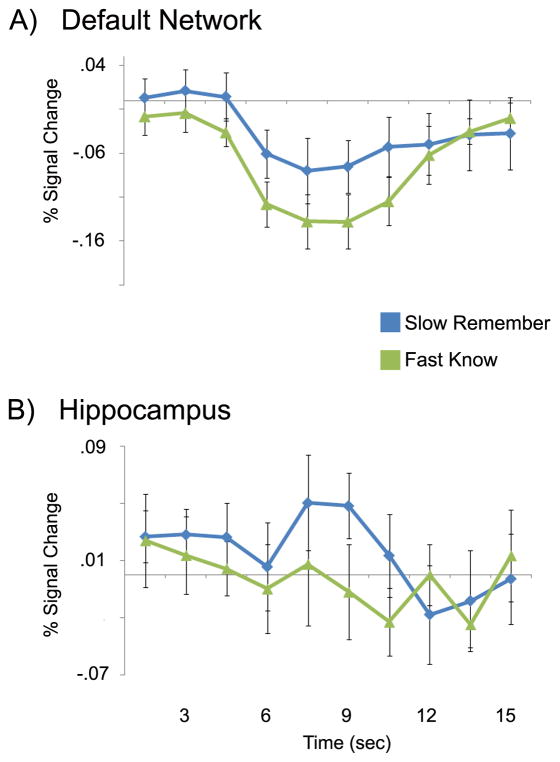
Figure 5.
Reaction time does not account for all task-related differences in ‘remember’ and ‘know’ trial activity in the default-mode network and hippocampus. Impulse response curves for the A) default-mode network and B) hippocampus for ‘remember’ trials with reaction time slower than 1500 msec (‘slow remember,’ blue) and ‘know’ trials with reaction time faster than 1500 msec (‘fast know,’ green). Masks used to extract impulse response curves are the same as those in Figure 2. Y-axis is percent signal change; X-axis is time (seconds) after the onset of the stimulus. All impulse response curves are for correct trials only.

