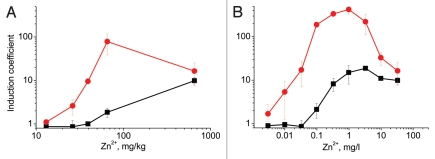
Figure 4.
Performance of P. putida KT2440(pDNPcadA1lux) (black squares) and KT2440.2431(pDNPcadA1lux) (red circles) in Zn-contaminated soil samples. (A) Induction of the bioreporters as a function of Zn2+ concentration in the soil samples. The x-axis shows the spiked Zn concentration in the soil. Each measurement point corresponds to a soil sample spiked with different concentration of Zn. (B) Induction of the bioreporters in the dilution series of the soil sample spiked with 654 mg/kg of Zn2+. The x-axis shows the actual Zn concentration in the diluted samples. Data represent the mean ± standard deviation of three independent experiments.

