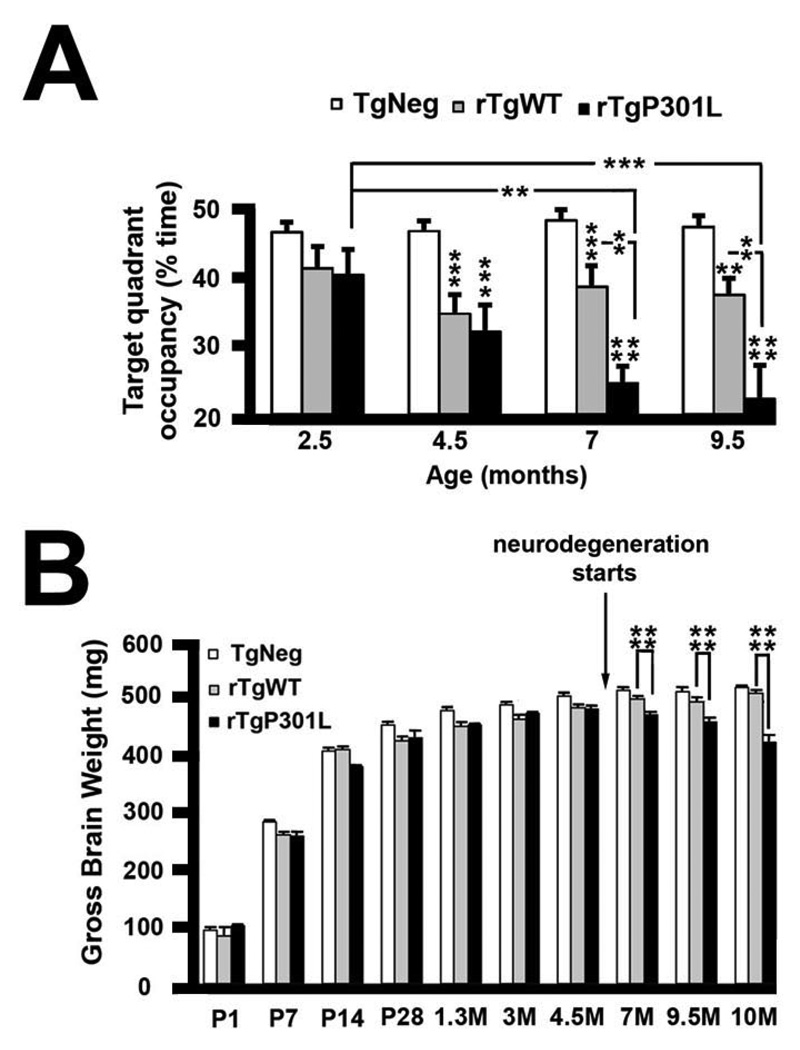
Figure 2. Lack of age-dependent memory deficits and neurodegeneration in rTgWT mice.
(A) rTgWT mice were longitudinally tested in the Morris water maze and compared to previously published data from the rTgP301L mice (Ramsden et al., 2005) [2.5M–9.5M n = 52 TgNeg, n = 17 rTgWT and n = 9 rTgP301L]. rTgWT mice showed deficits in performance in the Morris water maze compared to TgNeg mice. Deficits in rTgWT mice remained stable for several months, while deficits in rTgP301L mice became more severe with increasing age. Although rTgWT spent less time swimming in the target quadrant during probe trials compared to TgNeg mice, only the rTgP301L mice exhibited an age-related decline. Repeated measures ANOVA data are as follows: transgene: F(2,225) = 34.09, p < 0.0001; age versus transgene: F(6,225) = 3.61, p < 0.01 ; age, TgNeg mice: F(3,153) = 0.345, p = 0.79; age, rTgWT mice: F(3,48) = 1.518, p = 0.22; age, rTgP301L mice: F(3,24) = 5.82. (B) While both rTgWT and rTgP301L mice exhibited a significant decrease in whole brain weight early in life (1.3–4.5 months of age), suggestive of a developmental delay, the rTgP301L mice also exhibited neurodegeneration as evidenced by a progressive decrease in whole brain weight later in life (7–10 months of age). Due to small sample numbers at some ages, mice were binned into P1-P28, 1.3M-4.5M, and 7M-10M. Although there was a trend towards decreased brain weights at P1-P28, this was not statistically different. Data for transgene ANOVA are as follows: P1-P28: F(2,82) = 0.524, p = 0.5939; 1.3M-4.5M: F(2,156) = 14.564, p < 0.0001; 7M-10M: F(2,141) = 66.957, p < 0.0001. Sample sizes for TgNeg, rTgWT, rTgP301L, respectively, are as follows: P1, n = 13, n = 2, n = 2; P7, n = 20, n = 3, n = 2; P14, n = 17, n = 4, n = 4; P28, n = 9, n = 5, n = 4; 1.3M, n = 18, n = 5, n = 12; 3M, n = 35, n = 15, n = 14; 4.5M, n = 26, n = 21, n = 13; 7M, n = 19, n = 14, n = 19; 9.5M, n = 12, n = 9, n = 12; 10M, n = 36, n = 9, n = 14. M, months; **p < 0.01, ***p < 0.001, ****p < 0.0001. See also Figure S1 for details on the creation and characterization of rTgWT mice.

