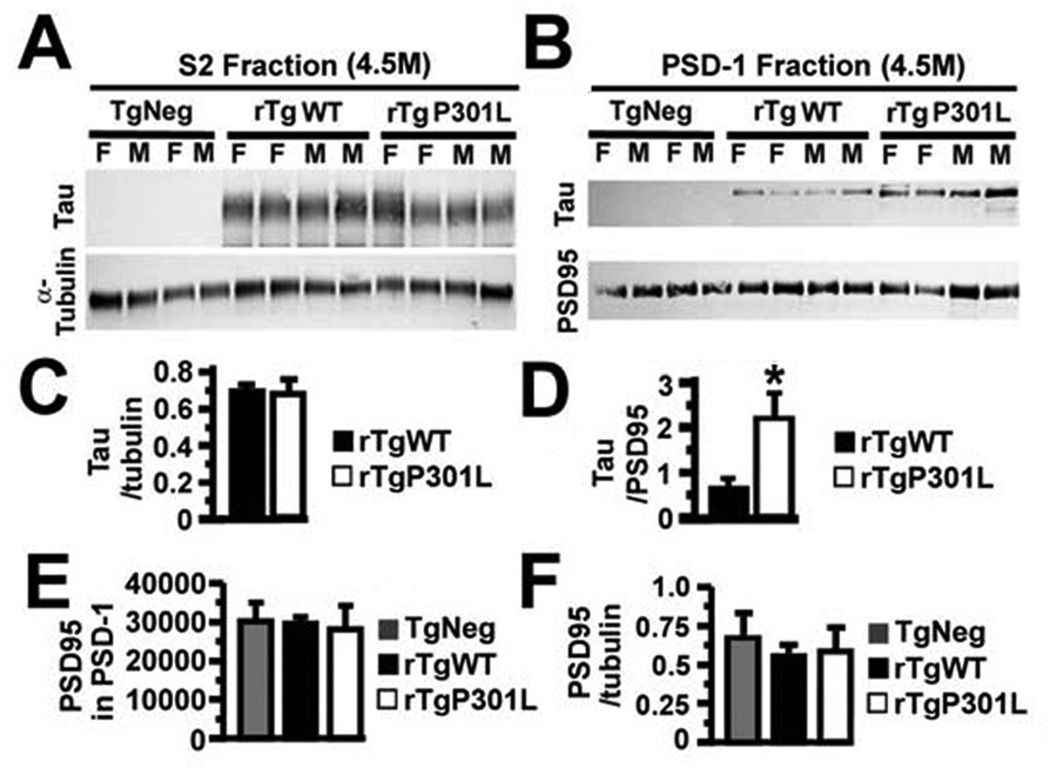
Figure 3. Human tau levels in the forebrains of rTgP301L and rTgWT mice.
(A) Tubulin and htau proteins in the S2 fraction of forebrains from 4.5-month old (4.5M) TgNeg, rTgWT and rTgP301L mice. (B) PSD95 and htau proteins in the PSD-1 fractions of forebrains from the animals in (A). (C) There was no difference in the normalized levels of htau expression between rTgWT and rTgP301L mice in the S2 fraction. (D) There was more htau, normalized to PSD95, in the PSD-1 fractions of rTgP301L mice. (E) There was no difference in the levels of PSD95 between TgNeg, rTgWT and rTgP301L mice. (F) Levels of PSD95 did not change in relation to a-tubulin between TgNeg, rTgWT and rTgP301L mice. n = 9–10 mice per group. M, male; F, female. t-test (C, D), ANOVA followed by Bonferroni post-hoc analysis (E), *p < 0.05.

