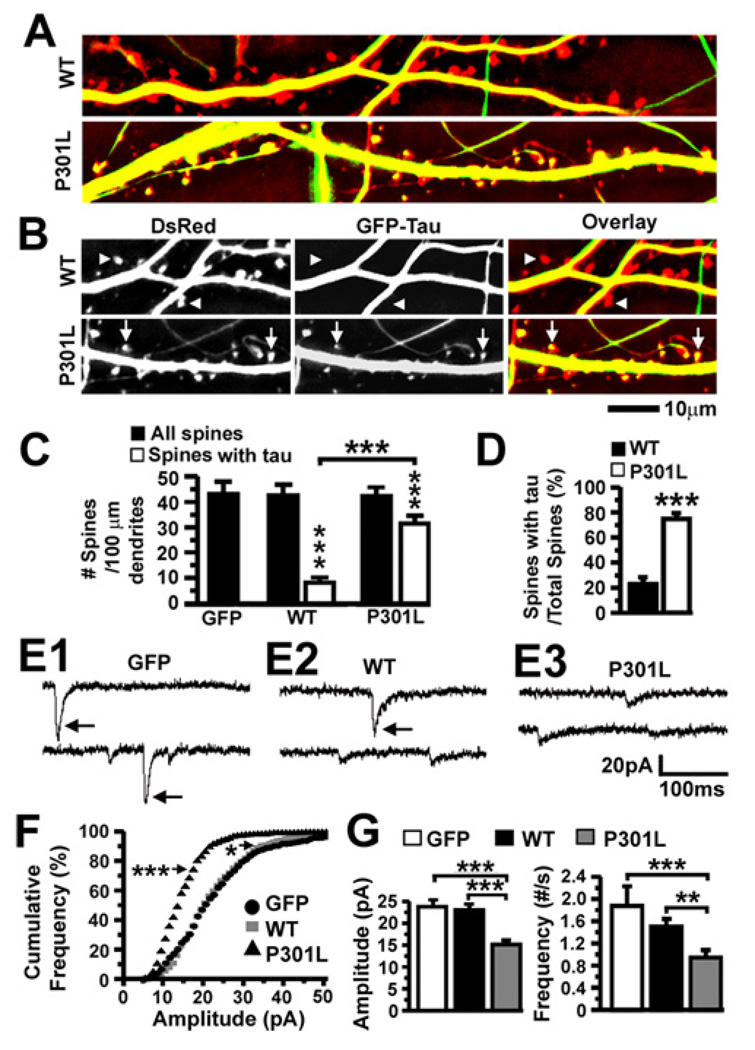
Figure 4. Effects of the FTDP-17-linked P301L mutation on tau accumulation in dendritic spines and excitatory synaptic transmission in transfected rat neurons.
(A) Overlaid images of living dissociated rat hippocampal neurons (21–28 DIV) co-expressing DsRed and GFP-tagged htau proteins. (B) Cropped images from (A) including DsRed, GFP and overlaid images. Triangles denote dendritic spines devoid of WT htau and arrows denote spines containing P301L htau. See also Figure S2 for unprocessed raw images of cultured rat neurons co-transfected with DsRed and GFP-WT htau or GFP-P301L htau. (C) Quantification of total spines and htau-containing spines in neurons expressing GFP or co-expressing DsRed and GFP-tagged htau. There was more htau in the dendritic spines of neurons expressing P301L htau. n = 27 (GFP), 26 (WT) and 25 (P301L) neurons per group. (D) A higher percentage of spines contained htau in neurons expressing P301L htau. (E) Representative mEPSCs in neurons expressing GFP (E1), GFP-tagged WT htau (E2) and GFP-tagged P301L htau (E3). Large mEPSCs occurred frequently in neurons expressing GFP or WT htau, but rarely in neurons expressing P301L htau. (F) Cumulative frequency distributions of mEPSC amplitudes of the neurons in (E). There were markedly more small mEPSCs in neurons expressing P301L htau than those expressing GFP. There was also a slight, but significant, decrease in the proportion of large events in neurons expressing WT htau. (Bin size = 1 pA) (G) Mean mEPSC amplitudes and frequencies of the neurons in (E). Neurons expressing P301L htau exhibited smaller and fewer mEPSCs. n = 14 (GFP), 14 (WT) and 16 (P301L) neurons per group. ANOVA followed by Bonferroni (C) or Fisher’s PLSD (G) post-hoc analysis, t-test (D), Kolmogorov-Smirnov (F), *p < 0.05, **p < 0.01, ***p < 0.001.

