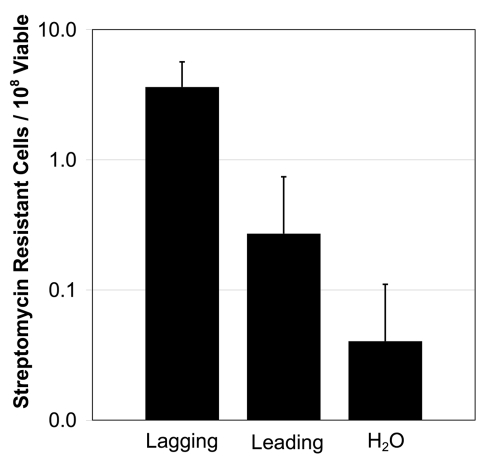
Figure 1.
Frequency of streptomycin resistance in P. syringae cells. Cells were electroporated with 5 µg of a 74 nt oligo matching the lagging or leading strand of the rpsL gene or no oligo control (H2O). Then the frequency of streptomycin resistance was determined. Results are the average of three experiments, error bars show standard deviation.

