
Fig. 2.
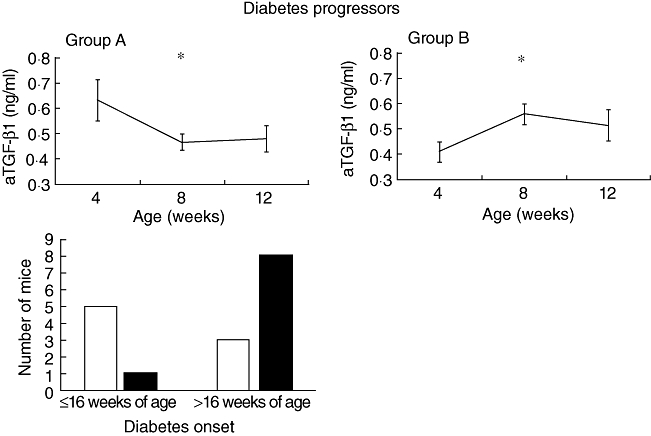
Upper panel: serum active transforming growth factor (aTGF)-β1 during the first 8 weeks of observation in diabetes progressor mice. Group A (n = 8): diabetes progressor mice that show between the 4th and 8th weeks of age reduction or no variation of the aTGF-β1 values. Group B (n = 9): diabetes progressor mice that show an increase of the aTGF-β1 values between the 4th and 8th weeks of age. Lines represent mean ± standard error of the mean. Group A: *P = 0·01, 4 versus 8 weeks of age; group B: *P < 0·01, 4 versus 8 weeks of age by Wilcoxon's signed rank test. Lower panel: distribution of mice belonging to group A (□) and B ( ) according to time of diabetes onset. P = 0·04 by Fisher's exact test.