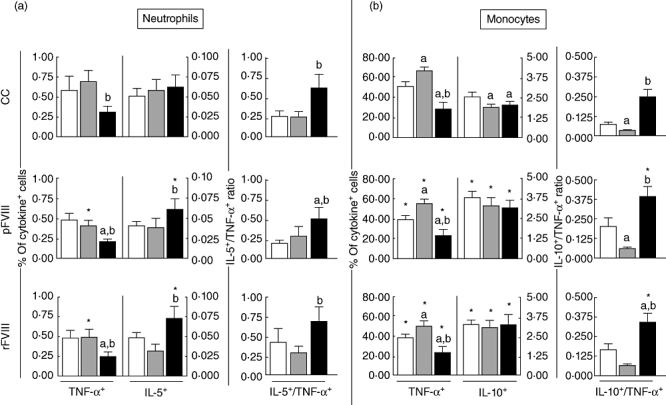
Fig. 2.

Analysis of intracytoplasmatic cytokine profile of (a) neutrophils and (b) monocytes from peripheral venous blood of blood donor (BD) (white bars), haemophilia A factor VIII [HAα-FVIII(−)] (light grey bars) and HAα-FVIII(+) (dark grey bars) groups. Data from control (CC) and FVIII-stimulated cultures (pFVIII and rFVIII). Statistical significance at P < 0·05 are represented by letters ‘a’, ‘b’ and ‘c’ for comparisons with BD, HAα-FVIII(−) and HAα-FVIII(+) groups, respectively. Significant differences between culture types in the same group were marked with ‘*’. The number of gated neutrophils and monocytes analysed ranged from 19 500–22 500 and 1200–2100, respectively.
