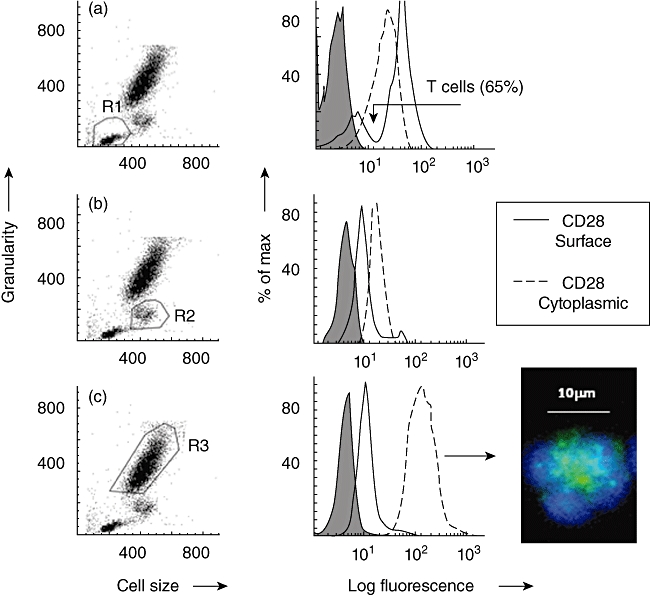
Fig. 1.
Demonstration of surface and cytoplasmic staining for CD28 by flow cytometry. Typical examples are shown as histogram overlays with an appropriate isotype control (shown as a grey infill) used to provide background values. (a) Dot-plot of forward-scatter (cell size) versus side-scatter (granularity) showing lymphocytes gated as region 1 (R1). The histogram overlay shows that CD28 was expressed on a distinct subpopulation of lymphocytes as indicated by the arrow i.e. T cells. (b) Dot-plot of forward- versus side-scatter showing monocytes gated as region 2 (R2). (c) Dot-plot of forward- versus side-scatter showing neutrophils gated as region 3 (R3). Cytoplasmic staining: cell surface staining (solid line) of viable cells was compared to staining following fixation and permeabilization of cells (dotted line). These experiments were conducted on leucocytes obtained from 10 healthy donors. Net mean fluorescence intensity (MFI) are shown below. A significant (Wilcoxon two-sample test) increase in net MFI following fixation and permeabilization, relative to surface values, indicates the presence of cytoplasmic ‘stores’ of CD28. Inspection of permeabilized granulocytes, showing distinctive polymorphonuclear morphology, by fluorescence microscopy confirmed that cytoplasmic CD28 (green) was confined to granules. Nuclear staining (blue) was demonstrated using 4′,6-diamidino-2-phenylindole (DAPI). No significant ‘stores’ were detected within T cells or monocytes. Data obtained from 10 healthy donors are shown below. Average MFI ± standard error of the mean shown
| CD28 net MFI for 10 donors | Lymphocytes (T cells) | Monocytes | Granulocytes |
|---|---|---|---|
| Control (surface) | 29·2 ± 5·2 | 6 ± 1·2 | 7·3 ± 1·2 |
| Fixed & Permeabilized (cytoplasmic) | 14·1 ± 3·4 | 9 ± 1·9 | 153 ± 37 P < 0·05 |

