
Fig. 8.
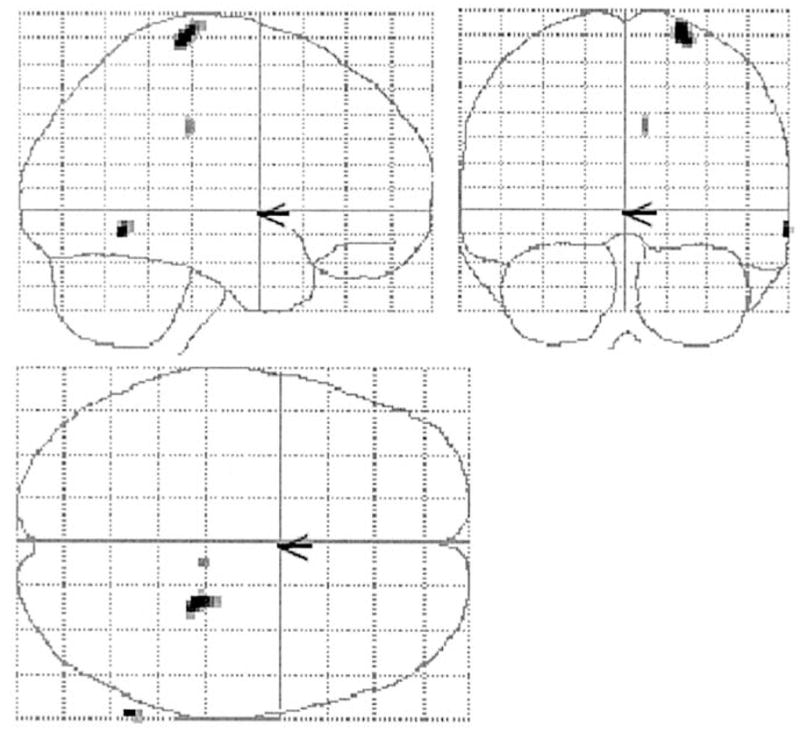
Two-dimensional projections (glass brain) of statistical parametric map depicting areas where regression slopes of CRV against brain activation differences (TD–NMC) were significantly more positive in the young than the elderly (P < 0.05 Bonferroni corrected).