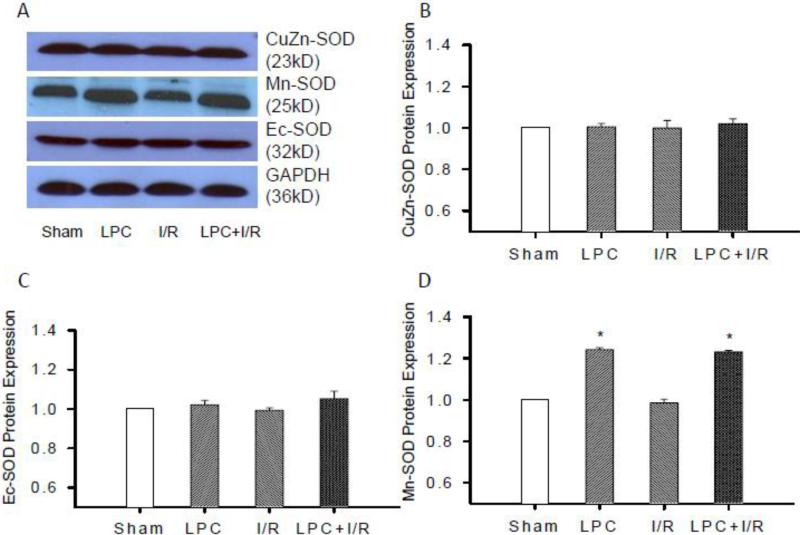
Fig. 5.
Protein expressions of SODs with Western blot. Tissue lysate of sham, LPC, I/R and LPC+IR groups were subjected to SDS-PAGE and immunoblot analysis using Mn-SOD, CuZn-SOD and EC-SOD antibodies, respectively. A, representative blots showing the changes in band intensity in different groups. Protein expressions of CuZn-SOD (B), EC-SOD (C) and Mn-SOD (D) were measured relative to the intensity of the sham groups. Mn-SOD protein expression was increased significantly in the LPC and LPC+I/R groups with no differences between the sham and I/R groups. However, CuZn-SOD and EC-SOD were not altered in LPC, I/R and LPC+I/R groups; *, p<0.05, LPC and LPC+I/R vs. sham group, N = 5/group.

