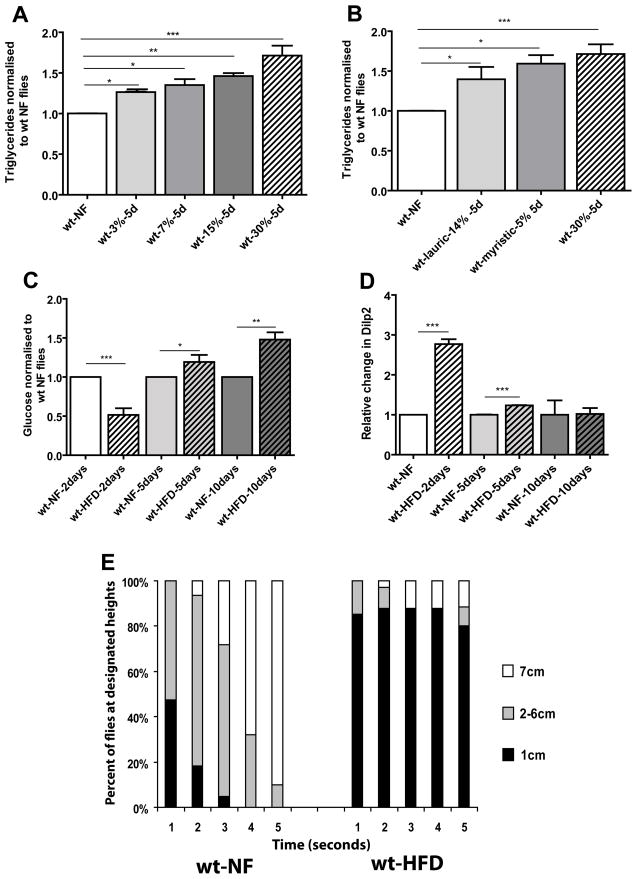
Figure 1. HFD-induced obesity leads to metabolic syndrome in flies.
A) Triglyceride content (expressed as relative change from NF flies) of 10–15 day old females on HFD for 5 days. The w1118 fly strain was used as wildtype (wt) in all experiments unless indicated otherwise. wt flies were used under 4 different concentrations of saturated fats. At least 3 independent experiments were done for each time point for all TG experiments. The concentrations used were 3 (n=46), 7 (n=49), 15 (n=31), 30% (n=81) for 5 days. wt type flies (n=107) showed a dose dependent increase in TGs (* = p<0.05, ** = p<0.01, ***= p<0.0001). B) Triglyceride content (expressed as relative change from NF flies) of 10–15 day old females on HFD for 5 days. The w1118 fly strain was used for the wildtype (wt) flies. wt flies were used two different types of saturated fats. Myristic and Lauric acid are both the major components of coconut oil. The amount of each fatty acid corresponds to its respective amount found in the 30% HFD. At least 3 independent experiments were done for each time point for all TG experiments. The concentrations used were lauric acid 14% (n=36), while myristic acid was 5% (n=35) and finally 30% of the original coconut oil mixture for 5 days. wt type flies showed a dose dependent increase in TGs (* = p<0.05, ** = p<0.01, ***= p<0.0001). C) Glucose content of female wt flies fed a 30% HFD (normalized to wt NF-fed flies of each appropriate age). Trehalose present in the hemolymph was converted to glucose (see M&M). Since 30% HFD gave us the strongest most consistent results we used 30% for all of the remaining experiments in this study. At least 3 independent experiments were done for each time point. After 2 days glucose decreases then rapidly increases after 5 and 10 days (* = p<0.05, ** = p<0.01, *** = p<0.0001). A minimum of 35 flies were used for each variable at each time point. D) Relative Dilp2 transcript levels in wt flies fed a 30% HFD for 2, 5 and 10 days. Dilp2 levels rapidly increase after 2 days then begin to decrease the longer the fly remains on a HFD (*** = p<0.0001). All qPCR were done in triplicate. E) Graphical representation of the effects of time and Geotaxic activity. Flies were filmed for 5 seconds then the movie was analyzed and individual flies were counted at each height 1cm being the lowest portion of the vial with 7 cm being the highest part of the vial. A minimum of 150 flies were used for each variable. All flies eventually moved to the top of the vial but we only counted the position of the flies to the allotted 5 second time span. Flies on a 30% HFD showed a significant decrease in geotaxic activity with approximately 80% remaining in the bottom of the vial for the allotted time span.

