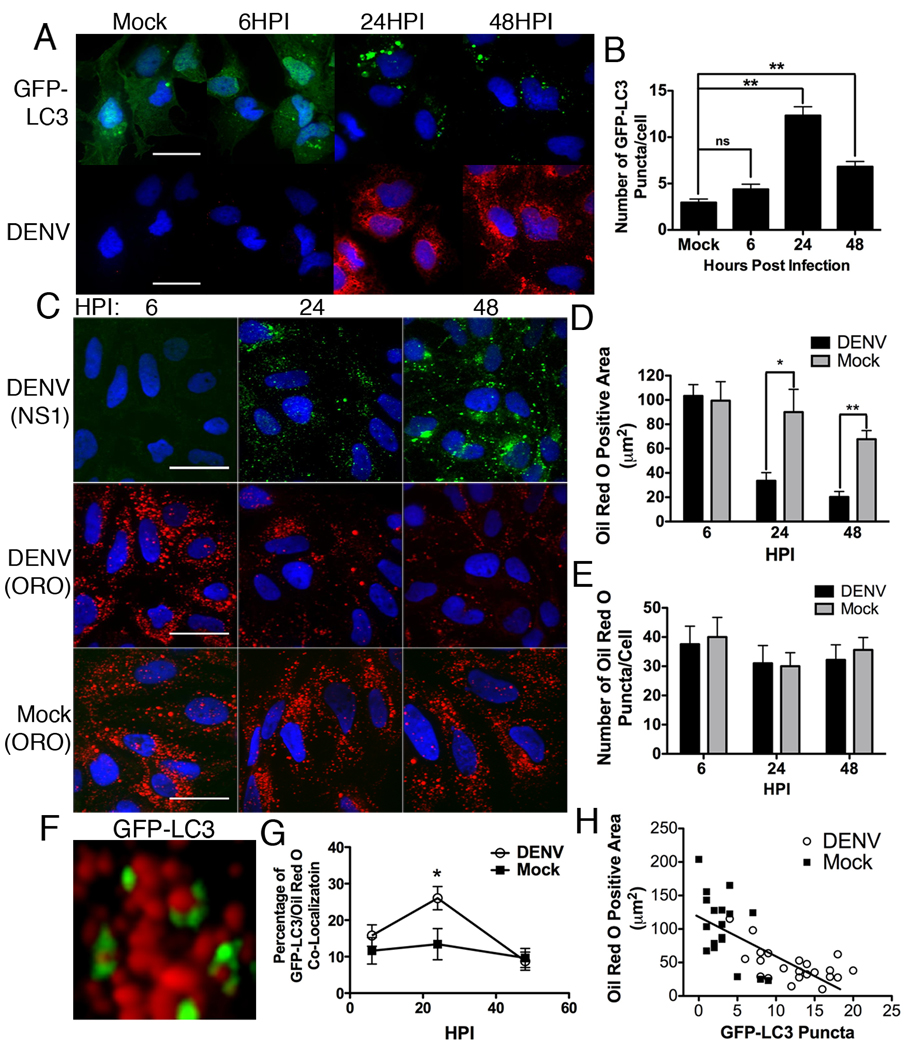
Figure 1. Lipid droplet area decreases as the number of GFP-LC3 puncta increase in DENV-infected cells.
(A) Huh-7.5 cells were transfected with a GFP-LC3 construct, then DENV- or mock-infected at an MOI of 2 for the indicated times, fixed, and probed with specific monoclonal antibody D1-4G2-4-15. Nuclei were visualized by DAPI staining. Scale bar = 30µm. (B) ImageJ quantification of the number of GFP-LC3 puncta per cell in (A) **p<0.001. (C) Huh-7.5 cells were DENV- or mock-infected at an MOI of 2 for the indicated times and then stained with oil red O to visualize lipid droplets and antibodies to NS1 were used to verify cells were infected. Scale bar = 30µm. (D) Quantification of the total oil red O positive area per cell representative of three independent experiments. *p<0.05, **p<0.001. (E) Quantification of the number of oil red O puncta per cell. (F) Huh-7.5 cells were transfected with a GFP-LC3 construct and then DENV infected for, a high magnification image of GFP-LC3 association with lipid droplets is shown. (G) Huh7.5 cells were DENV- or mock-infected for the indicated times. The association of GFP-LC3 positive structures with oil red O are quantified, *p<0.05. (H) Scatter plot of the number of lipid droplets and GFP-LC3 puncta in individual DENV- or mock-infected cells from random fields of view, 36HPI. The trend-line indicates a statistically significant (p<0.05) linear regression showing a negative correlation between the two variables.

