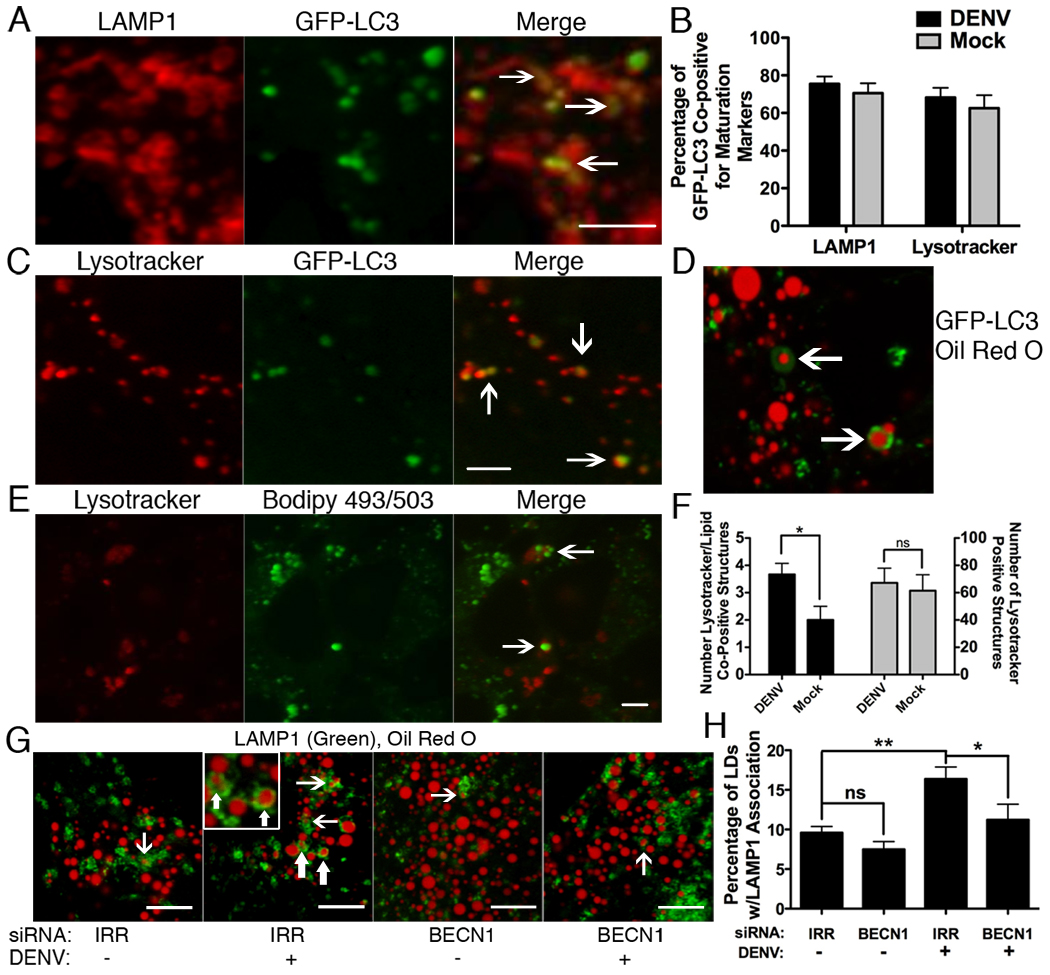
Figure 5. Increased delivery of lipids to acidified lysosomes in DENV-infected cells.
Huh-7.5 cells were transfected with GFP-LC3, then DENV-infected at an MOI of 3–5 for 24 hours, then (A) fixed and probed with antibodies against LAMP1 or (C) stained with Lysotracker. (B) ImageJ quantitation of co-localization of GFP-LC3 with LAMP1 or Lysotracker. (D) GFP-LC3 transfected cells were DENV infected for 24 hours and the association of Oil Red O and GFP-LC3 was visualized. (E) Huh-7.5 cells were DENV infected (MOI=2) for 24 hours before treatment with Lysotracker and Bodipy 493/503 to stain lipid droplets. Arrows indicate examples of Lysotracker positive structures containing lipids and are quantified in (F). The numbers of in (F) are per field of view. (G) Huh-7.5 cells were treated with indicated siRNAs and maintained for 48 hours, then mock- or DENV-infected at an MOI=2 for 24 hours, then fixed and stained with oil red O and antibodies against LAMP1. Arrows depict examples of co-positive structures. (H) Image J quantitation of 10 randomly selected fields of view from part (E), *p<0.05, **p<0.001. Scale bars = 5µm.

