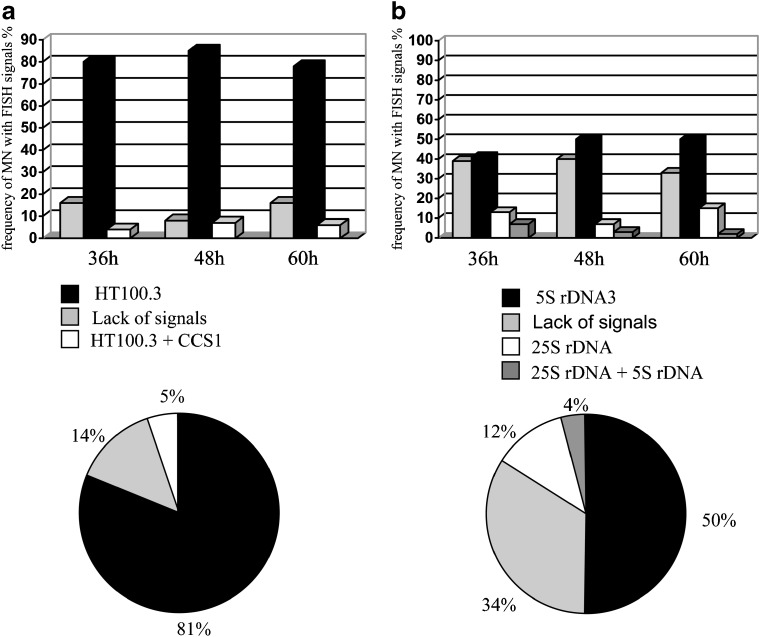
Fig. 5.
The frequency of micronuclei with signals of specific DNA sequences in barley cells after gamma irradiation in 36 h, 48 h, 60 h of postincubation. (a) FISH with telomeric and centromeric DNA as probes (b) FISH with rDNA as probes. The pie charts show data, which were pooled for all postincubation times

