Figure 5.
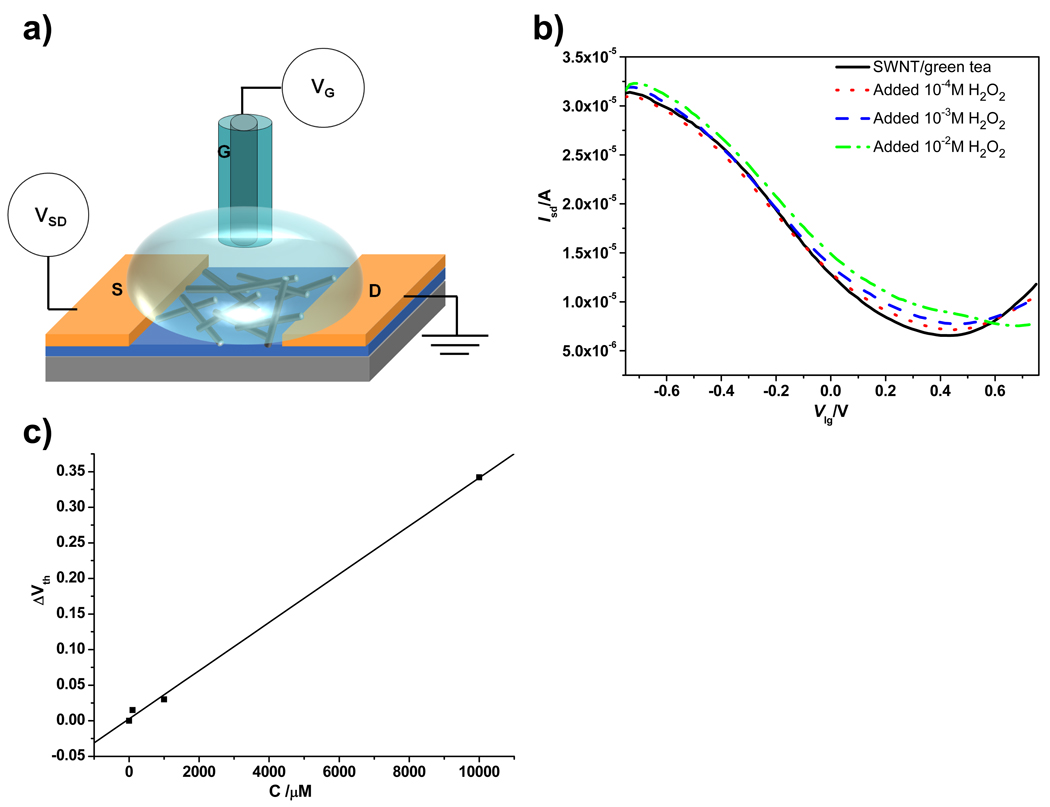
(a) Schematic illustration of the liquid-gate FET testing device setup. (b) Current versus liquid gate potential curves of SWNT/green tea composite device acquired before (black solid) and after adding 10−4 M (red dot), 10−3 M (blue dash) and 10−2 M (green dot dash) H2O2. (c) Threshold voltage shift versus H2O2 concentration plot.

