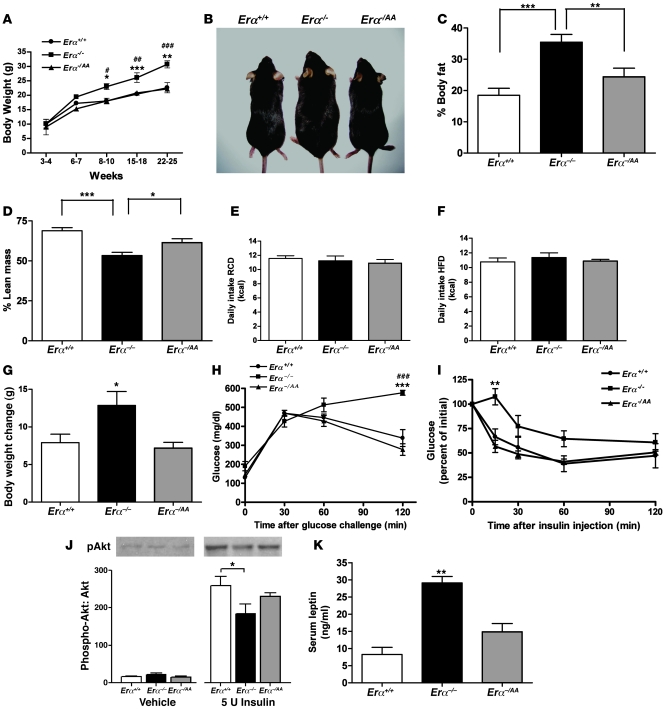
Figure 1. Nonclassical ERα signaling restores body weight and adiposity in Erα–/– mice to wild-type levels.
(A) Body weight measurements of Erα+/+, Erα–/–, and Erα–/AA female mice over a 25-week period beginning at weaning revealed a significant increase in Erα–/– body weight by week 8 (*P < 0.05, **P < 0.01, ***P < 0.001 versus Erα+/+; #P < 0.05, ##P < 0.01, ###P < 0.001 versus Erα–/AA; n = 5–10). (B) Appearance of Erα+/+, Erα–/–, and Erα–/AA mice. (C) NMR imaging revealed higher percent body fat in Erα–/– mice (**P < 0.01, ***P < 0.001; n = 7–11). (D) Percent lean mass was significantly lower in Erα–/– mice (*P < 0.05, ***P < 0.001; n = 7–11). (E) Daily food intake on RCD (P = 0.69; n = 8–10). (F) Daily food intake on HFD (P = 0.67; n = 8–10). (G) Body weight gain during HFD was significantly greater in Erα–/– mice than in Erα+/+ and Erα–/AA mice (*P < 0.05; n = 8–10). (H) Blood glucose concentrations after glucose challenge in anesthetized mice (***P < 0.001 versus Erα+/+; ###P < 0.001 versus Erα–/AA; n = 6–10). (I) Blood glucose concentrations after insulin injection (**P < 0.01; n = 6–10). (J) Effect of insulin on pAkt expression in soleus muscle (*P < 0.05; n = 6–8). (K) Serum leptin concentration (**P < 0.01 versus Erα+/+ and Erα–/AA; n = 6–10).

