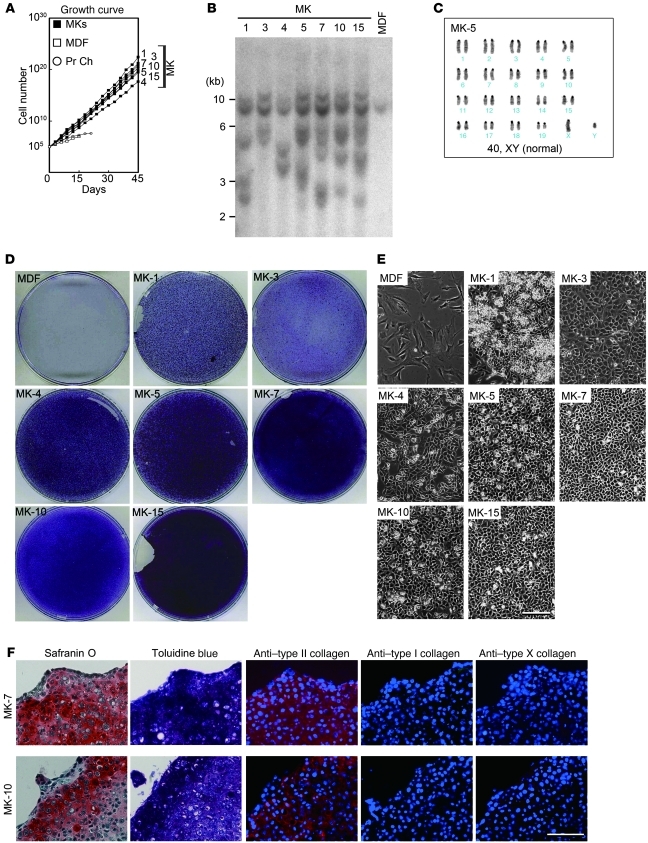
Figure 3. Characterization of induced cell lines.
(A) Growth curves of induced cell lines and MDFs. A total of 1 × 10⁵ cells were passaged every 3 days into each well of 6-well plates. Averages of 4 separate experiments are shown. (B) Southern blot analysis of genomic DNA extracted from MK lines and MDFs. Genomic DNA was digested with EcoRI and BamHI, separated on an agarose gel, transferred to a nylon membrane, and hybridized with Klf4 cDNA probe. (C) Karyotype of the MK-5 cell line. (D) When the calculated cell numbers in the growth curve exceeded 1010, the cells were replated on 10-cm dishes. MDF culture (passage 3) was used for a control. After reaching confluence, induced chondrogenic cells and MDFs were cultured for an additional 14 days and stained with alcian blue. (E) Cell morphologies of induced cell lines. Phase contrast images are shown. Scale bar: 100 μm. (F) Pellet culture of MK-7 and MK-10 cells. After 3 weeks of culture, pellets were recovered and processed for histological sections. Semiserial sections were stained with safranin O-fast green-iron hematoxylin and toluidine blue, and immunostained with anti–type II collagen antibodies, anti–type I collagen antibodies, and anti–type X collagen antibodies. Scale bar: 50 μm.

