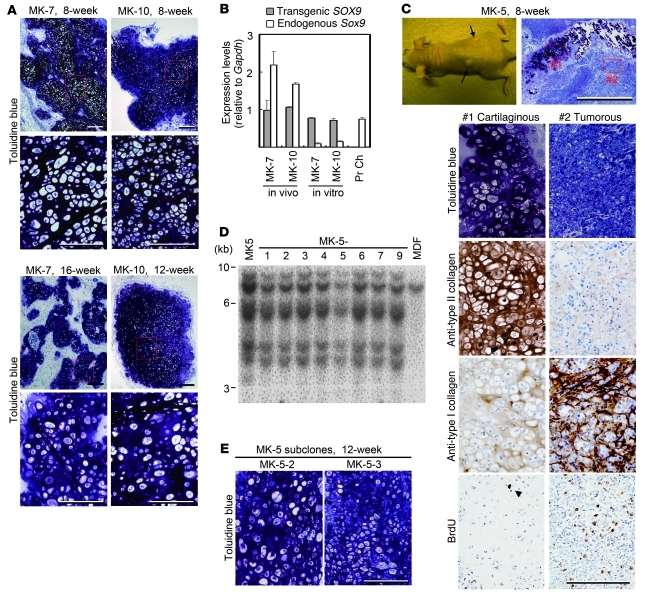
Figure 6. Prolonged of in vivo cartilage formation.
Semiserial sections were stained with toluidine blue and immunostained with antibodies, as indicated on the left. (A) Histology of tissues where MK-7 cells (8 and 16 weeks after injection) and MK-10 cells (8 and 12 weeks after injection) were injected. For each tissue, lower-magnification images are shown above and higher magnification images of boxed regions are shown below. Scale bars: 200 μm in top panel and 100 μm in bottom panel for each tissue. (B) RNA samples were extracted from cartilage tissue (in vivo) generated in nude mice by subcutaneous injection of MK-7 (16 weeks after injection) and MK-10 (8 weeks after injection) and from monolayer culture (in vitro) of MK-7 and MK-10 cells. Individual RNA expression levels were normalized to respective Gapdh expression levels. Error bars indicate mean ± SD (n = 3). (C) Injection of MK-5 cells produced tumors (arrows) 8 weeks after injection (top left panel). Histological sections of tumors stained with toluidine blue (top right panel). Magnifications of cartilaginous remnant (boxed region #1 in the top right panel) and tumor (boxed region #2 in the top right panel) are shown below. Scale bars: 500 μm in top right panel, 100 μm in bottom panels. (D) Southern blot analysis of genomic DNA extracted from MK-5 subclones, MK-5 cell line, and MDFs with Klf4 probe. (E) Histology of tissues where subclones of MK-5 cells were injected. Tissues were collected 12 weeks after injection. Scale bar: 100 μm.

