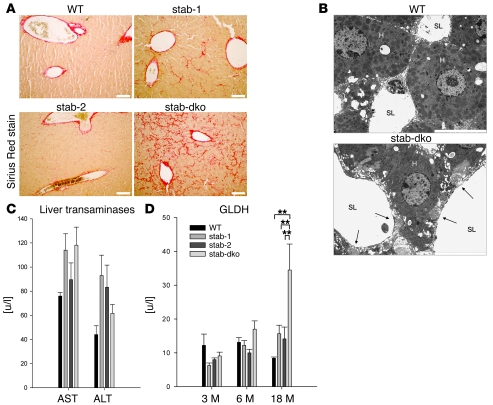
Figure 2. Liver phenotype of stabilin-deficient mice.
(A) Representative liver sections of 6-month-old WT, Stab1–/–, Stab2–/–, and Stab1–/–Stab2–/– mice of C57BL/6 genetic background were stained with Sirius red to identify the degree of fibrosis (n = 5). No Sirius red–positive fibers except around large blood vessels were detected in WT specimens, whereas few positive fibers were seen in Stab1–/– and Stab2–/– specimens. Sirius red staining of Stab1–/–Stab2–/– livers identified fibrotic fibers along the sinusoidal network. Original magnification, ×100. Scale bars: 100 μm. (B) Representative transmission EM images of liver sinusoids captured from 6-month-old WT as well as Stab1–/–Stab2–/– mice. Collagen fibers in the space of Disse close to the sinusoidal lumen are indicated by arrows. H, hepatocyte; SL, sinusoidal lumen. n = 3. Original magnification, ×10,000. Scale bar: 10 μm. (C) Activity levels of liver AST and ALT were measured in the plasma of 18-month-old C57BL/6 WT, C57BL/6 Stab1–/–, C57BL/6 Stab2–/–, and C57BL/6 Stab1–/–Stab2–/– mice. No statistically significant differences were found, indicating normal liver function even in very old Stab1–/–Stab2–/– animals. Data are mean ± SEM from 5 mice. (D) Activity levels of GLDH were measured in the plasma of C57BL/6 WT, C57BL/6 Stab1–/–, C57BL/6 Stab2–/–, and C57BL/6 Stab1–/–Stab2–/– mice of the indicated age as a marker of necrotic processes. A significant increase of GLDH was observed only in 18-month-old C57BL/6 animals. Data represent mean ± SEM from 5 mice. **P < 0.01 relative to Stab1–/–Stab2–/– values.

