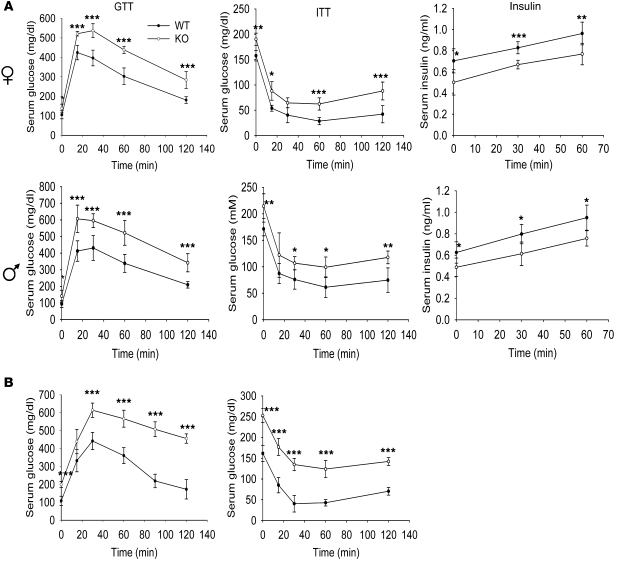
Figure 3. Col5a3–/– mice have impaired glucose tolerance and insulin sensitivity and are hypoinsulinemic.
(A) Serum glucose levels are shown in mg/dl for 3-month-old female and male wild-type and Col5a3–/– (KO) mice (n = 6 for each combination of gender and genotype) after glucose administration for glucose tolerance tests (GTTs) or after insulin administration for insulin tolerance tests (ITTs). Areas under glucose tolerance test glucose curves for wild-type and Col5a3–/– females were 22,428 and 34,074 mg/dl per 120 minutes, respectively, demonstrating a significant (P < 0.001) 1.52-fold difference. Areas under the glucose tolerance test glucose curves for wild-type and Col5a3–/– males were 25,884 and 36,882 mg/dl per 120 minutes, respectively, demonstrating a significant (P < 0.002) 1.42-fold difference. Plasma insulin levels (insulin) were measured for aliquots of glucose tolerance test samples from 0, 30, and 60 minutes time points. (B) Glucose tolerance test and insulin tolerance test glucose levels are shown in mg/dl for 1-year-old wild-type (n = 12) and Col5a3–/– (n = 10) mice (genders were not tested separately for these assays). Areas under glucose tolerance test glucose curves for wild-type and Col5a3–/– mice were 19,926 and 38,772 mg/dl per 120 minutes, respectively, demonstrating a significant (P < 0.0002) 1.95-fold difference. Data are presented as mean ± SEM. *P < 0.05; **P < 0.01; ***P < 0.001.

