Fig. 1.

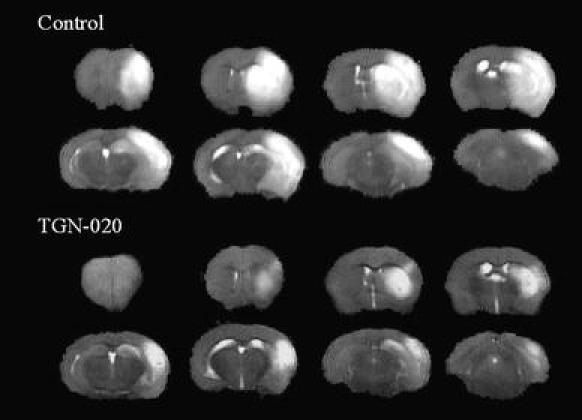
Representative FSE (TR = 2,000 ms, ETE = 80 ms) images of control (No. 3) and TGN-020 treated mouse (No. 5). Note that midline shift due to ischemic brain swelling is much less conspicuous in the TGN-020 treated mouse

Representative FSE (TR = 2,000 ms, ETE = 80 ms) images of control (No. 3) and TGN-020 treated mouse (No. 5). Note that midline shift due to ischemic brain swelling is much less conspicuous in the TGN-020 treated mouse