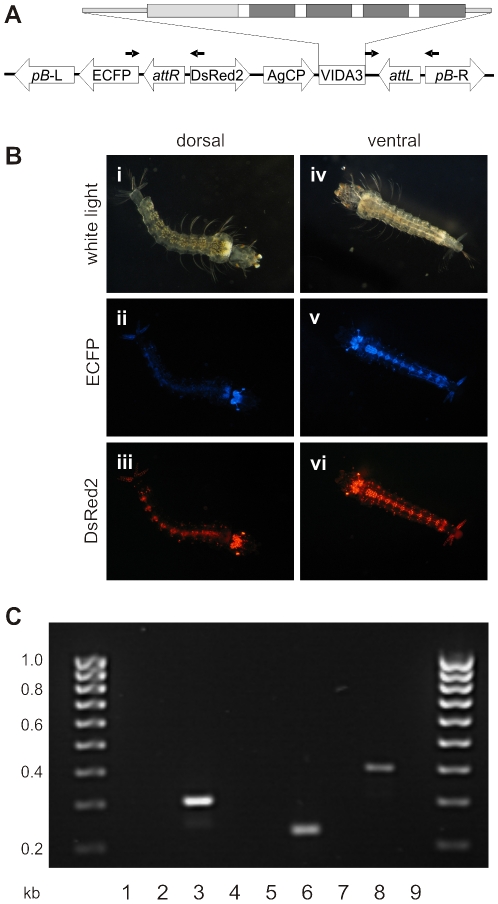
Figure 2. Genome organisation and characterisation of phase 2 site-specific integrations.
(A) Organisation of the occupied target site (not to scale) following site-specific integration of pBattB-DsRed2-AgCP-vida tet and resolution of attB and attP into attL and attR. The insertion is flanked by phase 1-specific left and right piggyBac terminal inverted repeats (pB-L and pB-R) and the ECFP fluorescent marker. Vida3 is expressed from the An. gambiae carboxypeptidase (AgCP) promoter and marked by 3xP3:DsRed2. The transcribed region (expanded) includes the AgCP 5′ and 3′ UTRs (light grey narrow boxes) and signal peptide (light grey wider box) and four copies of Vida3 (dark grey boxes), separated by linker sequences (white boxes). Arrows identify PCR primers that amplify fragments specific to attL and attR. (B) Fluorescence profiles of EVida3 phase 2 larvae; i, dorsal bright-field image; ii, dorsal ECFP image; iii, dorsal DsRed2 image; iv, ventral bright-field image; v, ventral ECFP image; vi, ventral DsRed2 image. In addition to eyes and optic nerves fluorescence is visible in cerebral ganglia, anal papillae and ventral nerve ganglia. Following integration in phase 2, strain E exhibits fluorescence in ventral nerve ganglia, which was not clearly visible in phase 1. This may reflect some degree of cross-talk between the two filter sets given the high intensity of the red fluorophore. Note also that DsRed2 expression is restricted to the cell nuclei by a nuclear localisation signal. (C) Confirmation of site-specific transgene integration in EVida3. PCR reactions with no template, strain E DNA or strain EVida3 DNA were established with specific primers for attL (301 bp, lanes 1, 2 and 3), attR (224 bp, lanes 4, 5 and 6) or attP (391 bp, lanes 7, 8 and 9).

