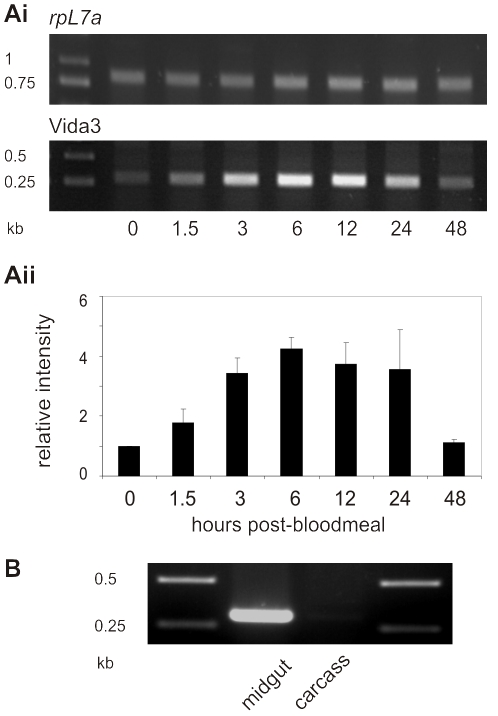
Figure 3. Expression of Vida3 from the AgCP promoter.
(A) Expression of Vida3 in strain EVida3 following a bloodmeal. (i) Representative gels showing semi-quantitative RT-PCR products of rpL7a (15 cycles, upper panel) and Vida3 (25 cycles, lower panel) from samples taken at 0, 1.5, 3, 6, 12, 24 and 48 hours post-bloodmeal. (ii) Mean relative intensity with standard errors of Vida3 PCR products. Following quantification, Vida3 RT-PCR bands were normalised to ribosomal protein rpL7a RT-PCR products from the same samples and expressed relative to the 0 time point. The histogram represents data from a minimum of two replicates. (B) RT-PCR of Vida3 expression in the midgut and carcass 6 hours post blood-meal.

