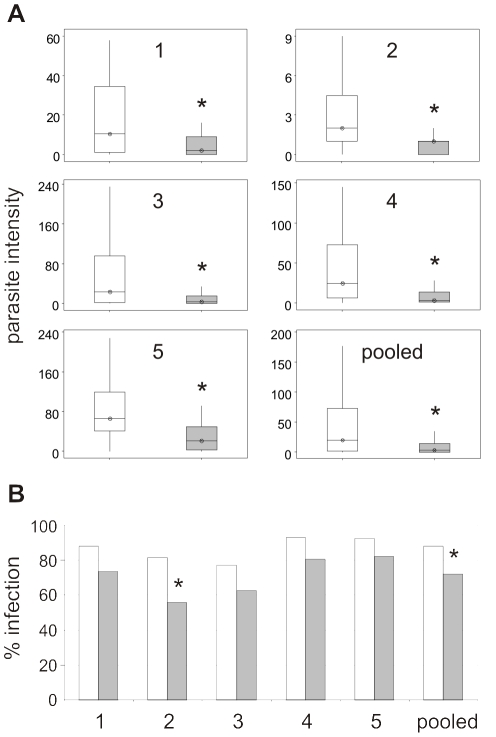
Figure 4. Parasite intensity and prevalence following P. y. nigeriensis infections of transgenic strains E and EVida3.
(A) Boxplots show intensity for strains E (white boxes) and EVida3 (grey boxes) from five independent experiments and the pooled data. Oocysts and melanised ookinetes were scored as invading parasites. Vertical lines denote the 95% confidence interval, horizontal lines with symbol mark the median and the interquartile range of the data is boxed. Probabilities for significant reductions in intensity in EVida3 (*) in experiments are: 1, P = 0.008; 2, P = 0.0007; 3, P = 0.009; 4, P<0.0001; 5, P<0.0001 and pooled data 1–5, P<0.0001. (B) Histograms show prevalence for strains E (white bars) and EVida3 (grey bars) in experiments 1–5 and the pooled data. Results from individual experiments indicate a trend towards a lower prevalence of infection in EVida3, which is only significant (*) for experiment 2 (P = 0.02) and the pooled data 1–5 (P<0.001).

