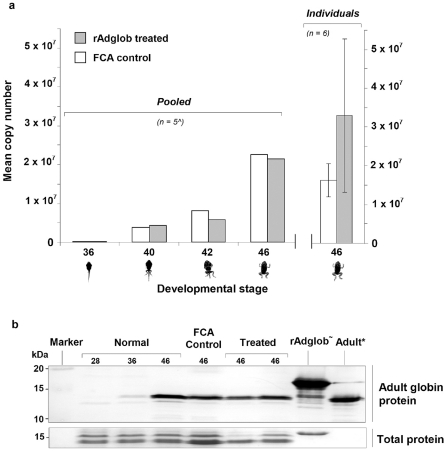
Figure 4. Adult globin mRNA and protein expression levels in treated and untreated Bufo marinus.
a: The profile of adult globin mRNA expression across metamorphosis for treated rAdglob injected (grey shading) and control FCA only injected (white) animals was determined by real time-PCR analysis. Each stage point indicates the overall expression level for five pooled (∧) animals, with treated and control animals showing similar copy numbers. The last stage point represents an average of 6 individuals. Adult globin copy number was normalised to a toad actin housekeeping gene. b: Western blot analysis of whole animal extracts (upper panel) provides a general indication of the adult globin protein levels in normal developing animals (stages 28, 36 and 46), as well as FCA control and rAdglob treated animals. The lower panel shows the Coomassie brilliant blue staining for the same blot and provides an indication of total protein loading. rAdglob (∼) is an additional 3.3 kDa larger than native adult globin due to Hisx6 tag and linker. Adult (*) control was generated using purified globin from the RBCs of adult B. marinus. The blot is representative of rAdglob treatments (n = 10) and FCA controls (n = 9).

