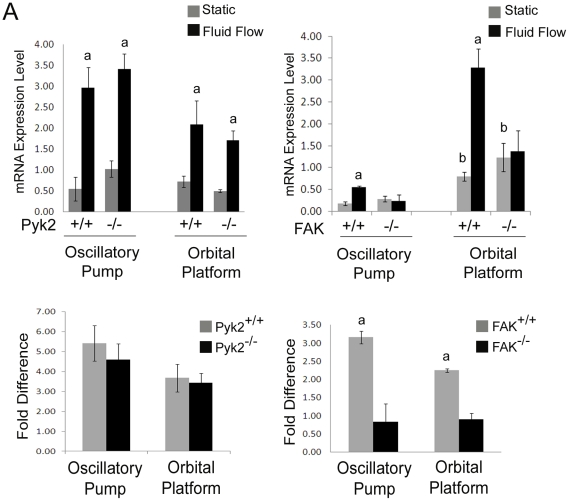
Figure 4. Analysis of OPN expression in osteoblasts exposed to FF.
(A) Expression of OPN mRNA as determined by qRT-PCR analysis of Pyk2+/+ and Pyk2−/− osteoblasts exposed to either 2 hour of FF followed by a 20 hour post-flow incubation or maintained in static culture conditions. (B) Expression of OPN mRNA as determined by qRT-PCR analysis of FAK+/+ and FAK−/− osteoblasts exposed to either 2 hour of FF followed by a 20 hour post-flow incubation or maintained in static culture conditions. (C) Graphical representation of data in Fold Difference. Experiments were performed in triplicate, and n≥3 for each experimental group in each trial. Error bars represent standard error. aStatistically significant difference between static and FF (p<0.05). bStatistically significant difference between static conditions (p<0.05).

