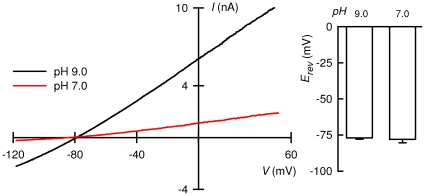
Figure 3. Constancy of apparent K+/Na+ selectivity in TASK-2 after inhibition by extracellular acidification.
Current-voltage relation for a cell expressing TASK-2 at pH 9.0 and 7.0, chosen to yield respectively ∼90 and ∼15% of the maximal activation as judged from complete activity vs. pH curves [20]. The intracellular solution contained 140 mM K+ and extracellular bath had 135 mM Na+ and 5 mM K+. The current-voltage relations were taken from 250 ms-voltage ramps given from the most hyperpolarised voltage. The graph on the right-hand side summarises average Erev measurements at both pH values in the form of means ± SEMs of 6 experiments. There was no significant difference between Erev as analysed by paired t-test.

