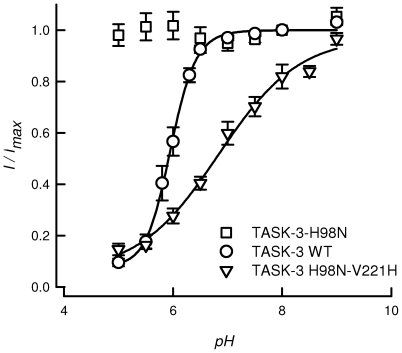
Figure 4. Conferring pHo sensitivity to a TASK-3 insensitive mutant by TASK-2 pHo-sensor transplantation.
The graph shows extracellular pH-dependence curves of WT TASK-3 (circles, n = 8) and for its mutants TASK-3-H98N (squares, n = 6) and TASK-3-H98N-V221H (triangles, n = 8). Results are shown as means ± SEM. The lines are fits of the Hill equation and were constructed using the average of fitted parameters of the individual experiments.

