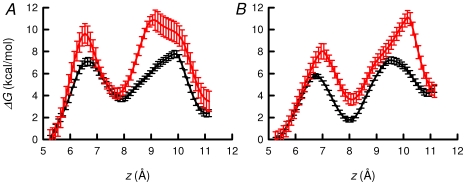
Figure 6. Free energy profile obtained from ABF calculation, delineating the transport of a K+ ion across TASK-2 channel permeation pathway.
The error bars represent the standard error of the free energy difference at each z in the final free energy profile. A, The free energy profile of system with the R224 residues neutralized in both monomers (black line) and the charged-charged situation (red line). B, Free energy profile of system with neutral-R2240-A224 state of TASK-2 (black line) and charged R224+-A224 state (red line).

