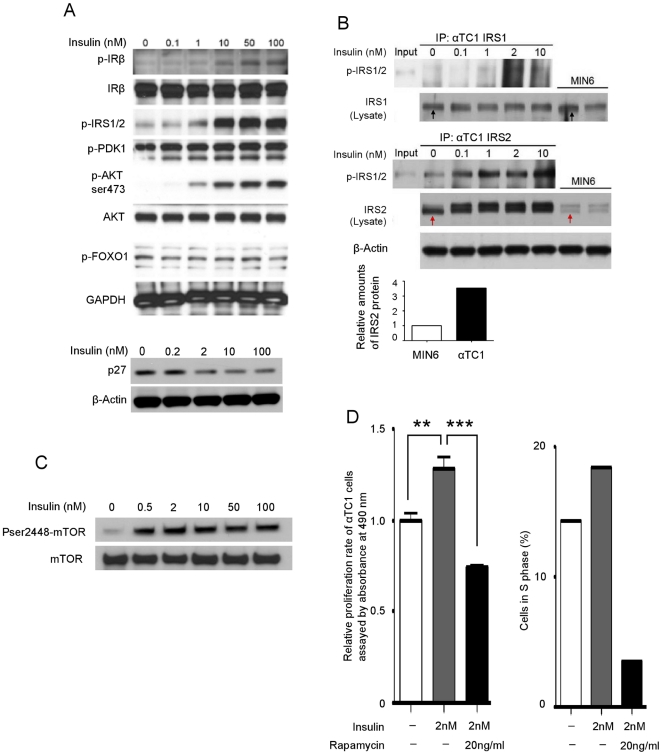
Figure 4. IRs signal through IRS2 and AKT and activate mTOR, resulting in α-cell proliferation.
(A) Western blot analysis of insulin receptor signaling molecules in α cells. αTC1 cells were treated with increasing concentration of insulin for 10 minutes and whole cell lysate was used for western blotting. (B) Immunoprecipitation of IRS1 and IRS2 in pancreatic cells. αTC1 cells were treated with increasing concentration of insulin for 10 minutes and whole cell lysates was collected. IRS1 and IRS2 proteins were immunoprecipitated, and immunoblotted with an antibody that recognizes phosphorylated IRS1/2 (Tyr612). Protein levels of IRS1 (black arrows) and IRS2 (red arrows) in αTC1 and MIN6 cells. The densitometry represents relative expression of IRS2 protein levels. (C) αTC1 cells were treated with increasing concentration of insulin for 10 minutes and whole cell lysate was blotted for phosphorylated and total mTOR. (D) α-TC1 cells were treated for 72 hours (left panel) or 24 hours (right panel) with insulin (2 nM) +/− rapamycin (20 mg/ml). The cell proliferation was assessed by both ELISA-based relative proliferation assay (left panel: data are expressed as means ±SEM [n = 6]; ** p<0.005, *** p<0.0005) and by counting the cells in S phase (propidium iodide staining for DNA cell cycle analysis) (right panel).

