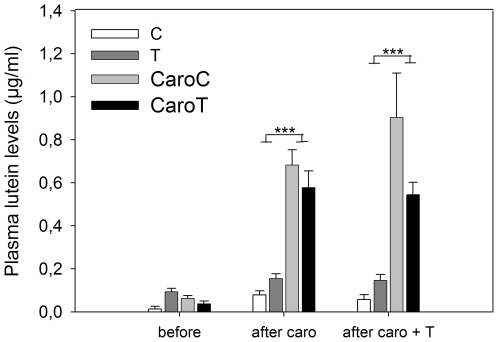
Figure 1. Plasma lutein levels (means ± SE) before carotenoid supplementation, after carotenoid supplementation and after carotenoid supplementation + T-implantation.
Non-supplemented groups: sham-implanted (C – white) and T-implanted (T – dark grey), and the carotenoid-supplemented groups: sham-implanted (CaroC – light grey) and T-implanted (CaroT – black) (CaroT: N = 10, all others: N = 9). Significant differences within periods are shown: ***p<0.001.

