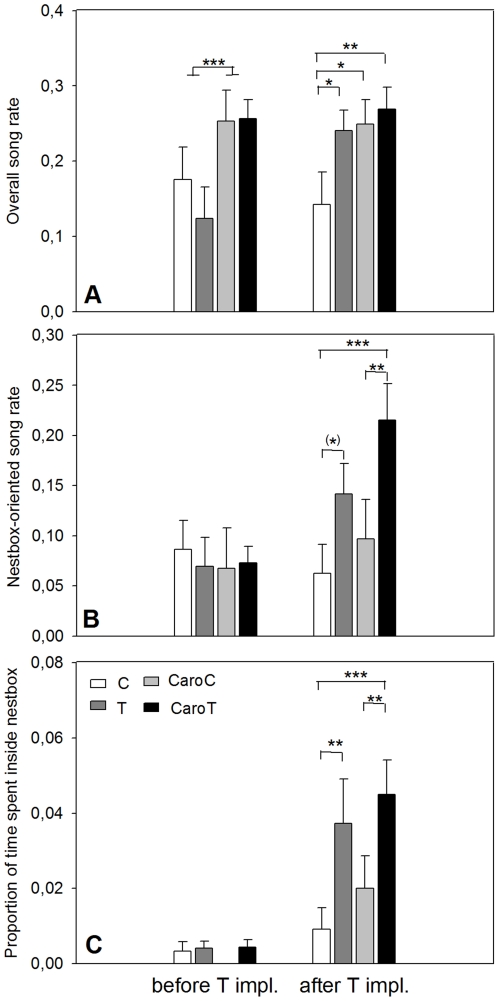
Figure 3. Overall song rate, nestbox-oriented song rate and time spent inside nestbox (means ± SE), before and after T-implantation.
Non-supplemented groups: sham-implanted (C – white) and T-implanted (T – dark grey), and the carotenoid-supplemented groups: sham-implanted (CaroC – light grey) and T-implanted (CaroT – black) (CaroT: N = 10, all others: N = 9). Significant differences within periods are shown: (*)0.05<p<0.10, *p<0.05, **p<0.01, ***p<0.001.

