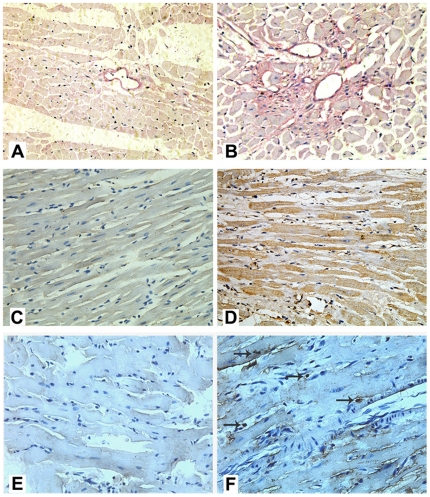
Figure 4. Comparison of myocardial pathology between control (A, C, E) and IGT (B, D, F) rats.
A—B: Cardiac glycogen identified by PAS staining, the glycogen granules were stained into prunosus, cellular nuclei were stained into blue; C—D: macrophage migration inhibitory factor (MIF) detected by immunohistochemistry, the MIF was stained into brown; E—F: The apoptosis of myocardial cells detected by TUNEL, the brown showed apoptotic cells, the blue showed nuclei.

