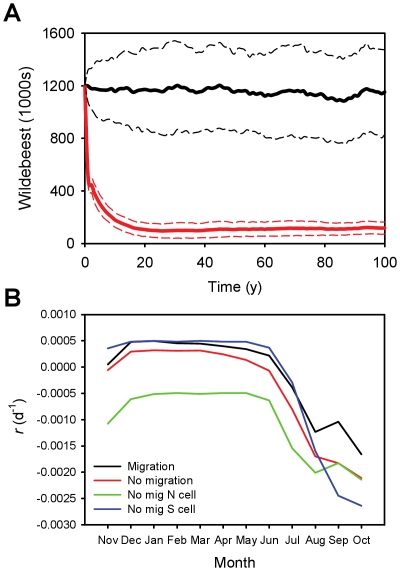
Figure 4. Simulated effects of movement on wildebeest population size in the Serengeti:
A) mean (100 runs) population size for the default (no barrier, migration/movement allowed) scenario (black) from Fig. 2 and a no migration scenario in which wildebeest are treated as residents and prevented from moving among lattice cells (red). The standard deviations for each scenario are indicated with dashed lines. B) Mean monthly per capita population change (r) weighted spatially by wildebeest occupancy during the initial 10-year period of population collapse shown in A: the migration and no migration scenarios are contrasted, as well as values of r for individual cells from the northern woodlands (N cell) and southern plains (S cell) from the no migration scenario.

