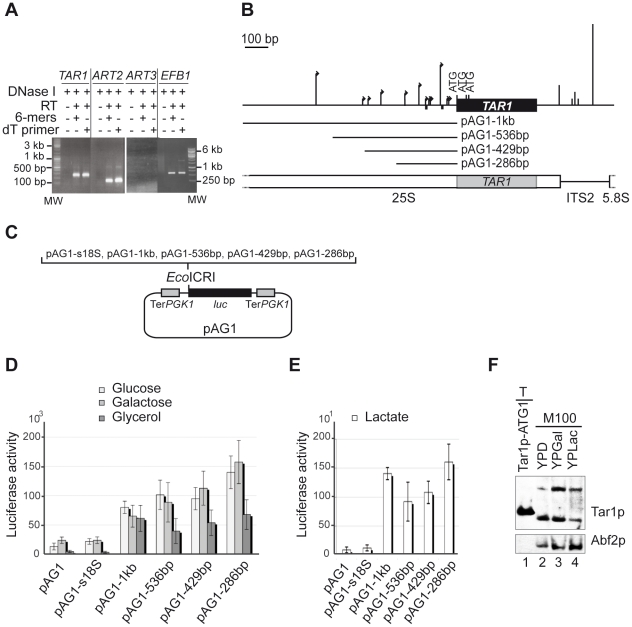
Figure 5. Characterization of the TAR1 transcripts - Expression of TAR1 in fermentable and non-fermentable conditions.
(A) RT-PCR analyses were performed on total RNA extracted from wild-type W303 strain grown in galactose medium. After DNase treatment (DNase I, +) and reverse transcription (RT, +) with random hexamers (6-mers, +) or oligodT primer (dT primer, +), PCR was performed using gene-specific primers (as indicated; Table S1). Samples without RT (-) were used as controls for DNA contamination. RT-PCR product's length (600 bp) generated from the transcript of the intron-containing gene EBF1 confirmed the absence of genomic contamination. Expecting sizes of RT-PCR products were TAR1: 258 bp, ART2: 156 bp, and ART3: 204 bp. (B) Schematic representation of TAR1 showing 5′ and 3′ ends mapped by 5′ and 3′ RACE. Size of arrows (5′ ends) and of vertical lines (3′ ends) is proportional to the number of amplification products identified at indicated positions: −37 (x1), -45 (x1), −75 (x6), −123 (x1), −130 (x1), −146 (x1), −178 (x3), −241 (x2), −355 (x2), −415 (x1), −440 (x1), and −657 (x5) (5′ ends); +109 (x3), +170 (x1), +181 (x2), +198 (x1), and +266 (x12) (3′ ends). Numbering refers to −1 as the first residue upstream the first ATG codon and to +1 as the first residue beyond the TGA stop codon. Small black squares represent putative TATA elements (−73 and −144). ITS2: internal transcribed sequence 2 of Pol I transcript. Grey box represents TAR1 ORF in the 25S rDNA. TAR1 5′ flanking regions tested in (C) are indicated (pAG1-1 kb, pAG1-536 bp pAG1-429 bp, pAG1-286 bp). (C) Schematic representation of the plasmid-borne reporter system used to test promoter activity of TAR1 5′ flanking regions. The empty vector pAG1 and the pAG1-s18S construct were used as negative controls. pAG1-s18S contains a 500 bp region of 18S rDNA devoid of small ORFs. TerPGK1: terminator of the PGK1 gene; luc: Firefly luciferase gene; EcoICR1: cloning site. (D–E) Histograms showing luciferase activities from indicated construct and indicated growth condition. The values (in relative light units per milligram of total protein per second) are averages of five independent assays. Error bars are indicated. Note the different scales of the two histograms. (F) Expression of endogenous Tar1p in fermentable or non-fermentable carbon sources. Mitochondria (M100, 100 µg) were purified from W303 strain grown in glucose (YPD), galactose (YPGal) or lactate (YPLac) rich medium. Tar1p and the matrix marker Abf2p were detected with the anti-Tar1p and anti-Abf2p antibodies, respectively. Five µg of total cell extract (T) from W303 strain expressing plasmid-borne Tar1p-ATG1 (124 aas) were loaded in parallel.

