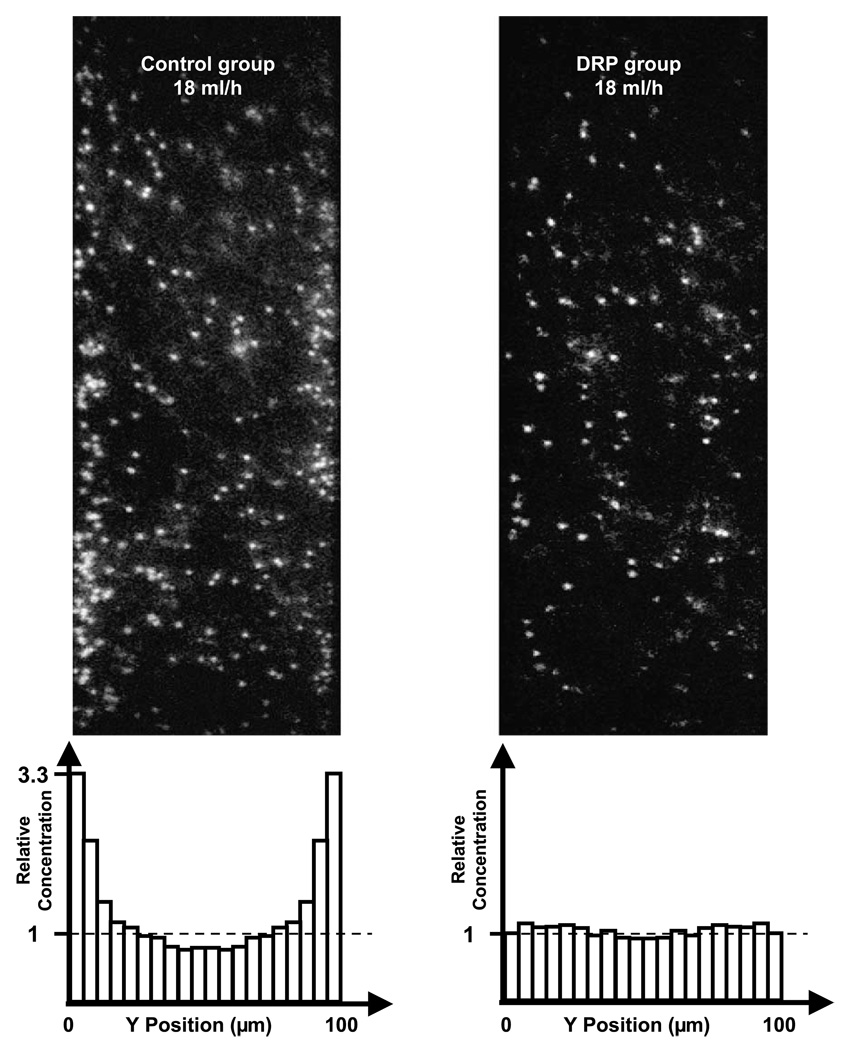
Fig. 4.
Concentration profiles and representative images of relative concentration of platelet sized particles in RBC suspension (Ht = 36%, flow rate 18 ml/h). Left: control sample; right: DRP sample (with 10 ppm PEO); top: raw images; bottom: histograms of relative concentration averaged from 100 images.

