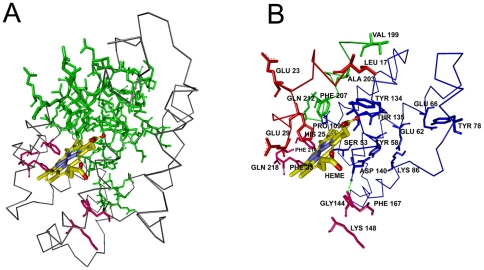
Figure 2. Three dimensional structure of one chain of human HO-1 chain.
a) with Heme (yellow), interaction path (green) and the cliques (pink). b) Enlarged version showing interaction path residues and cliques (pink) with their labels. Green dashed line represents the hydrogen bond between Gly144 and Asp140.

