Figure 4.
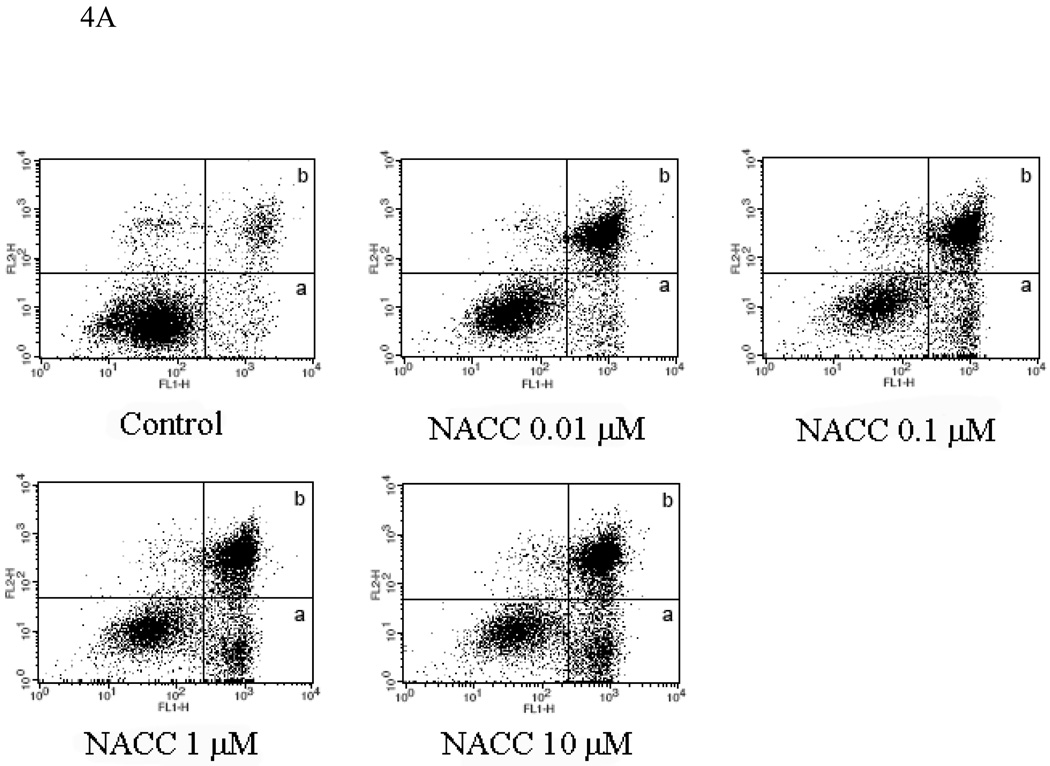
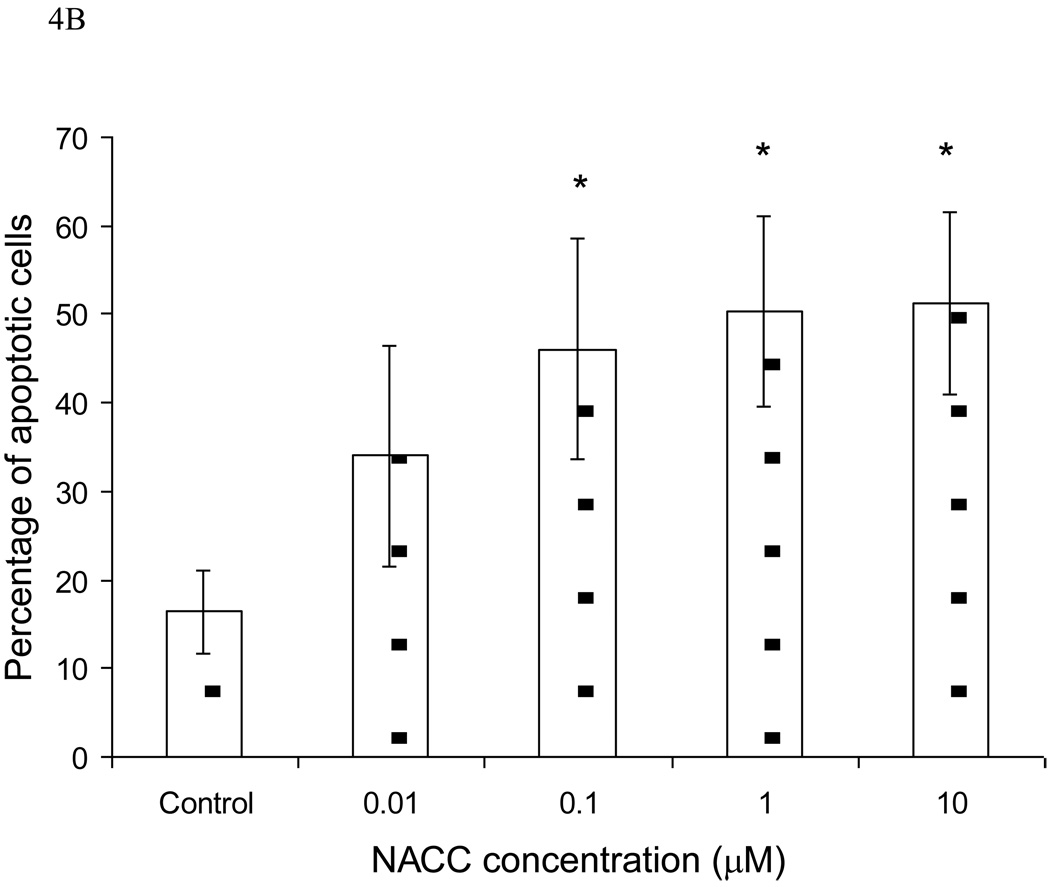
Effect of NACC on induction of apoptosis in UACC-62 cells. UACC-62 cells were treated with different concentrations of NACC for 6 days. After staining with Annexin V and PI, apoptotic cells was analyzed by flow cytometry. The total percentage of apoptotic cells is the sum of early apoptotic cells (Graph A, area a) and late apoptotic cells (Graph A, area b). Graph A presents apoptotic histograms derived from one of the three independent experiments. Graph B presents the summarized data. Results are presented as the mean ± SD of three independent experiments.
* indicates statistical significance (P < 0.05) in NACC treated groups as compared to the control.


