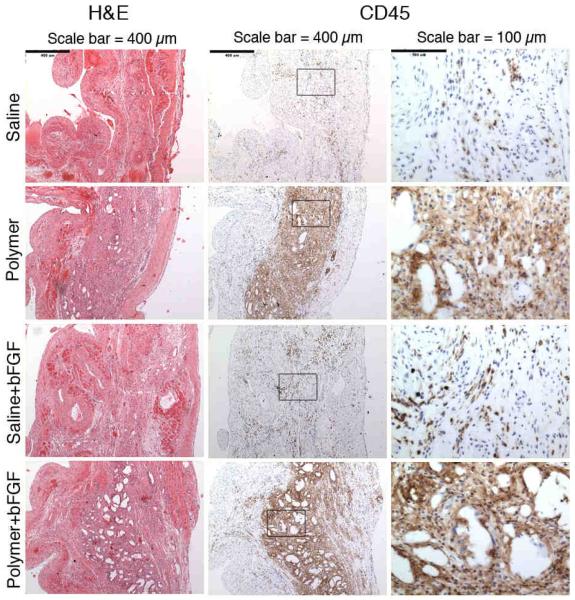
Figure 7.
Representative images stained with hematoxylin and eosin (H&E) (left column) or CD45 (middle and right columns) at 28 days post-injection with saline, polymer, saline+bFGF, or polymer+bFGF. Scale bar indicates 400 μm in left and middle columns and 100 μm in right column. Note the intense CD45+ inflammatory infiltrate in hearts receiving polymer injections. Void spaces likely reflect residual polymer, dissolved during histological processing.

