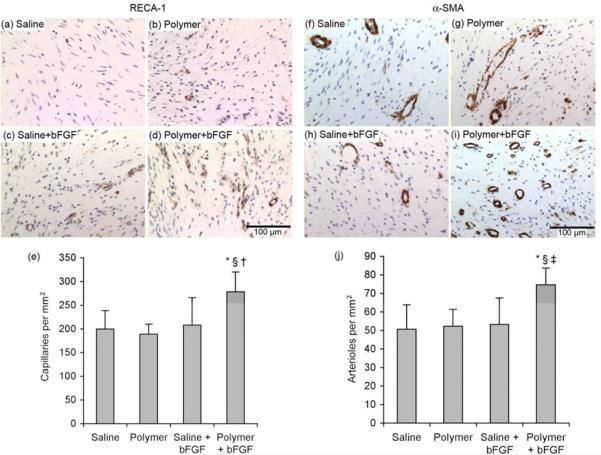
Figure 8.
(a-e) Capillary density evaluated by rat endothelial cell antigen-1 (RECA-1) staining and (f-j) arteriolar density evaluated by smooth muscle α-actin (α-SMA) staining. (a-e) Representative images of sections with endothelial cell staining (dark brown stain indicates positive antibody staining for RECA-1) after 28 days of treatment with (a) saline (n=9), (b) polymer (n=9), (c) saline+bFGF (n=7), or (d) polymer+bFGF (n=9). (e) Quantification of capillary density following 28 days of treatment. (f-j) Representative images of sections with smooth muscle cell staining (dark brown stain indicates positive antibody staining for α-SMA) after 28 days of treatment with (f) saline (n=9), (g) polymer (n=9), (h) saline+bFGF (n=7), or (i) polymer+bFGF (n=9). (j) Quantification of arteriolar density following 28 days of treatment. Scale bar indicates 100 μm. *p<0.001 versus saline, §p<0.001 versus polymer, †p<0.05 versus saline+bFGF. ‡p<0.001 versus saline+bFGF.

