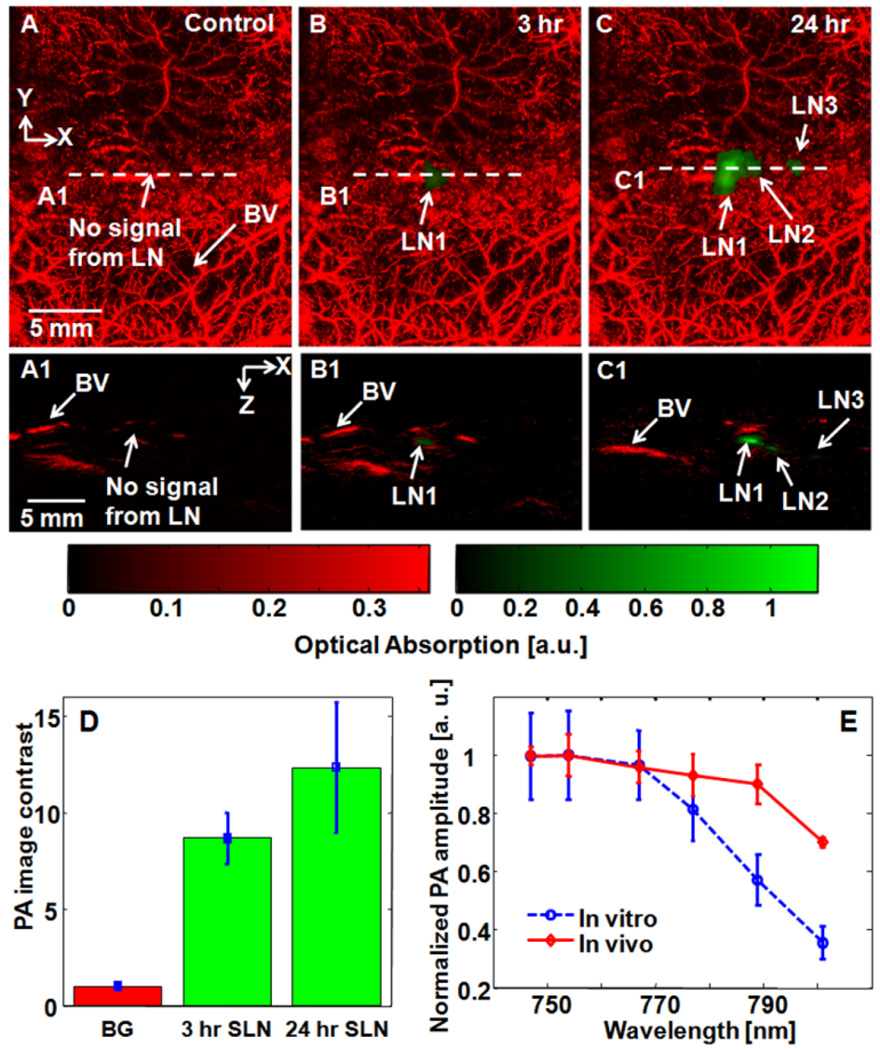
Figure 5.
Noninvasive PA MAP images of the left axillary region of a rat. (A) Control image acquired before PPCy-C8/PFC nanoparticles. (B) PA image at 3 hr post-injection. (C) PA image at 24 hr post-injection. (A1), (B1), and (C1) Corresponding B-scan images along the cuts A1, B1, and C1, in Figs. 5A, 5B, and 5C. (D) Average PA image contrast from SLNs at 3 and 24 hrs post-injection (n=3). Error bars represent SD. (E) Comparison of spectroscopic PA amplitudes between in vitro and in vivo results. BV: blood vessels; LN: lymph node; SLN: sentinel lymph node; BG: background. Red color: blood vessels; green color: lymph nodes.

