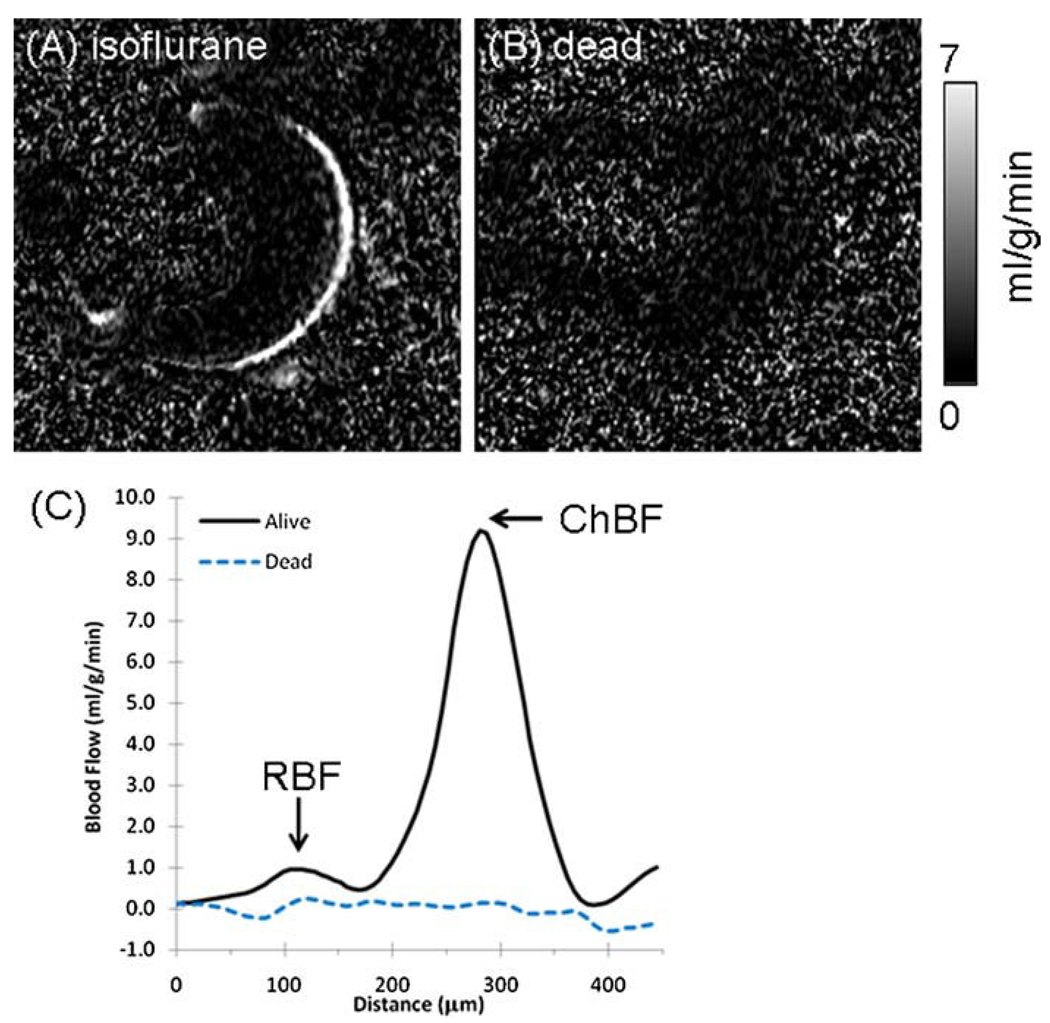
Figure 1.
(A) Layer-specific blood flow image from a mouse under 1.1% isoflurane. (B) Blood flow acquired in a dead mouse in the same setting (same animal). Scale bar indicates blood flow values from 0 to 7 mL/g/min. (C) Blood flow profiles from the images in (A) and (B). chBF, choroidal blood flow; rBF, retinal blood flow.

