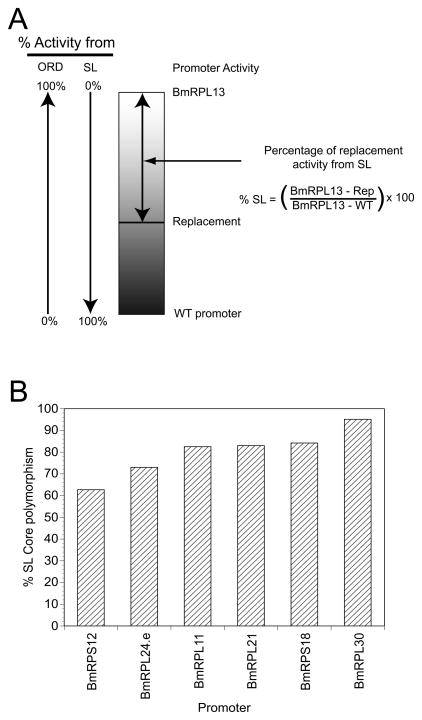
Figure 2. Estimation of what proportion of the activity exhibited by each promoter was attributable to polymorphisms in the SL addition domain.
Panel A: Rationale for calculation of the proportion of activity derived from the SL addition domain and other regulatory domains. The rectangle represents the possible activity range exhibited by the 22nt replacement mutants, ranging from that of the corresponding wild type promoter to that of the BmRPL13 promoter. Vertical arrows indicate the proportion of activity exhibited by a given replacement mutant that can be attributed to either the SL addition domain (SL) or the other regulatory domains (ORD). For the SL addition domain, as described in Section 3, this contribution would range from 0% for a replacement mutant with an activity identical to that of BmRPL13, to 100% for a mutant with an activity identical to that of the corresponding wild type promoter. Conversely, for the ORDs, the contribution would range from 0% for a replacement mutant with an activity identical to the corresponding wild type promoter to 100% for a replacement mutant exhibiting an activity identical to BmRPL13. The double headed arrow highlights the proportion of the overall activity difference that can be attributed to polymorphisms in the SL addition domain. Panel B: The relative contribution of polymorphisms in the SL addition domain to RP promoter activity, calculated using the method outlined schematically in Panel A.

